
Figure 5:
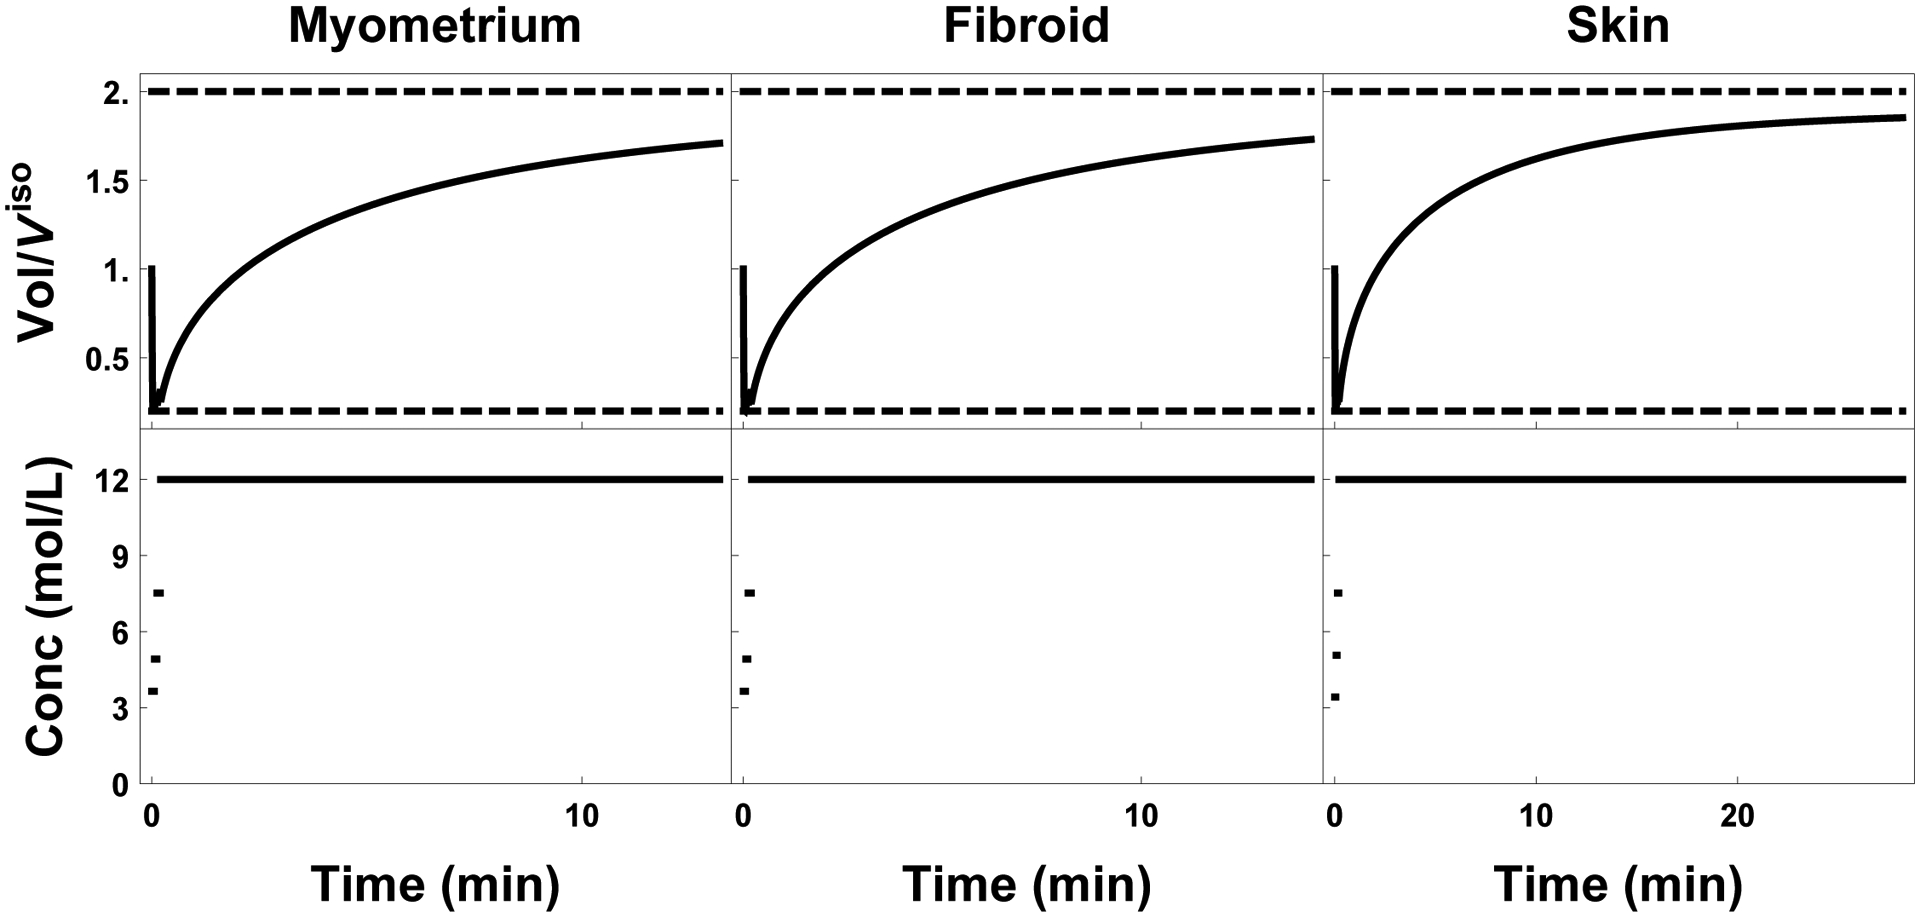
Plot of external cell volume (top row) as a function of the extratissue concentration (bottom row). Time optimal protocols for myometrium, fibroid, and skin are shown left to right respectively.
Official websites use .gov
A
.gov website belongs to an official
government organization in the United States.
Secure .gov websites use HTTPS
A lock (
) or https:// means you've safely
connected to the .gov website. Share sensitive
information only on official, secure websites.
Plot of external cell volume (top row) as a function of the extratissue concentration (bottom row). Time optimal protocols for myometrium, fibroid, and skin are shown left to right respectively.