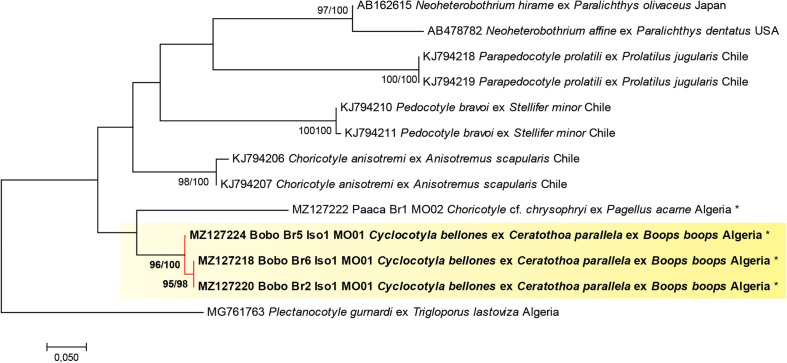
Figure 4.
Molecular phylogenetic analysis based on maximum likelihood, inferred from COI sequences of Cyclocotyla bellones in relation to other taxa of diclidophorids; a plectanocotylid was chosen as the outgroup. Values along branches indicate percentage bootstrap support for maximum likelihood and neighbour joining methods (ML/NJ). Nodes without bootstrap values had support lower than 50% and were omitted. There were a total of 389 positions in the final dataset. All specimens of Cyclocotyla bellones were grouped into a single monophylum and showed little variation (≤1%). The tree is drawn to scale, with branch lengths measured in the number of substitutions per site. ex: from.

