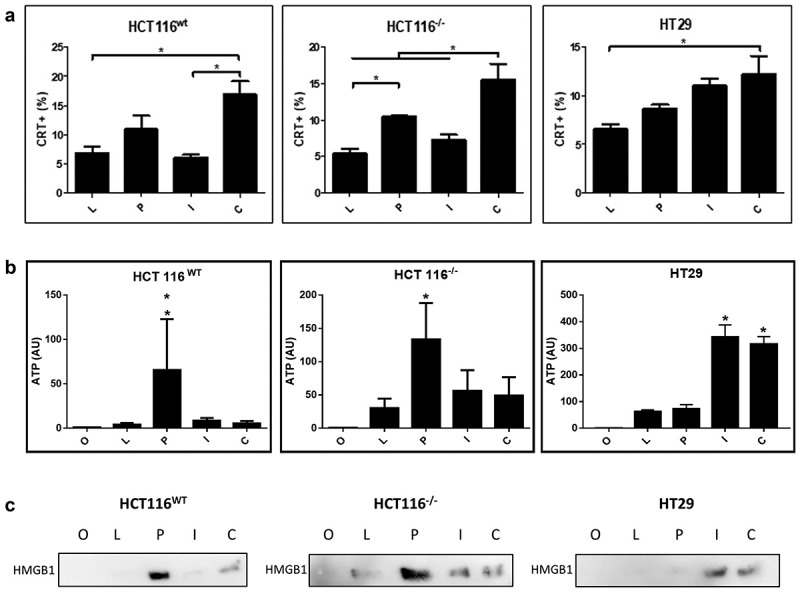
Figure 4.

Emission of immunogenic cell death markers in response do gene transfer
HCT116wt, HCT116−/- and HT29 (p53 R273H) cells were seeded in 24 wells plate (5.104 cells per well). After 24 h, cell number was verified and then transduced using AdRGD-PG-Luc (L), AdRGD-PG-p53 + AdRGD-PG-eGFP (P), AdRGD-PG-hIFNβ + AdRGD-PG-eGFP (I) AdRGD-PG-p53 + AdRGD-PG-hIFNβ (C) or no vector (O). Cells and supernatant were harvested at 72 hours post transduction and analyzed using the respective methodology. A. Percentage of cells with calreticulin (CRT+) exposure on the cell surface as observed by flow cytometry. (B) Detection of ATP measured as intensity of luciferase activity (AU, arbitrary units) and (C) release of HMGB1 measured by Western blot using equal quantities of conditioned medium. * p < .05 One Way Anova; Tukey posttest. Results represent the average and standard deviation of three independent experiments.
