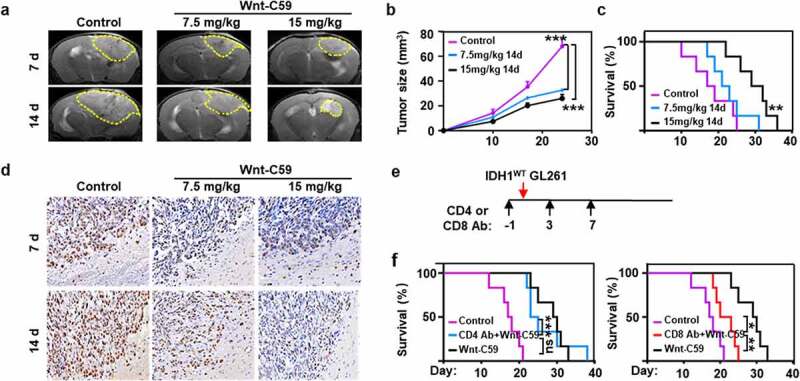
Figure 6.

Wnt/β-catenin signaling blockade shows therapeutic effects on IDH1WT glioma allografts. Representative T2-weighted MRI images (a) and the volumes (b) of IDH1WT GBM allografts after treatment with vehicle or Wnt-C59 (7.5 or 15 mg/kg) for 7 and 14 days (n = 4). Tumor margins are highlighted with yellow dashes. (c) Kaplan-Meier survival curves of IDH1WT model mice treated with 15 mg/kg Wnt-C59 (black line), 7.5 mg/kg Wnt-C59 (blue line) or control (purple line). Log-rank test p values for comparisons to controls are shown (n = 6, p = .003). (d) Ki67 staining in immunohistochemical images of IDH1WT gliomas after the above treatments. Scale bars, 50 μm; magnification 400 × . (e) Mouse models were treated with 100 μL CD4 antibody (Ab) (10 mg/kg) or CD8 Ab (9.5 mg/kg) at day −1, day 3 and day 7 post the IDH1WT glioma cells incubation. (f) Kaplan-Meier survival curves of IDH1WT glioma models treated with CD4 Ab plus 15 mg/kg Wnt-C59 (blue line), CD8 Ab plus 15 mg/kg Wnt-C59 (red line), 15 mg/kg Wnt-C59 (black line) or control (purple line). Log-rank test p values for comparisons to controls are shown (n = 6, CD4 Ab plus 15 mg/kg Wnt-C59 vs 15 mg/kg Wnt-C59 14 d, p = .782; CD4 Ab plus 15 mg/kg Wnt-C59 vs control, p < .001; CD8 Ab plus 15 mg/kg Wnt-C59 vs 15 mg/kg Wnt-C59 14 d, p = .007; CD8 Ab plus 15 mg/kg Wnt-C59 vs control; p = .04. In panel b, ***p < .001, control vs 7.5 mg/kg Wnt-C59 14 d or control vs 15 mg/kg Wnt-C59 14 d (one-way ANOVA)
