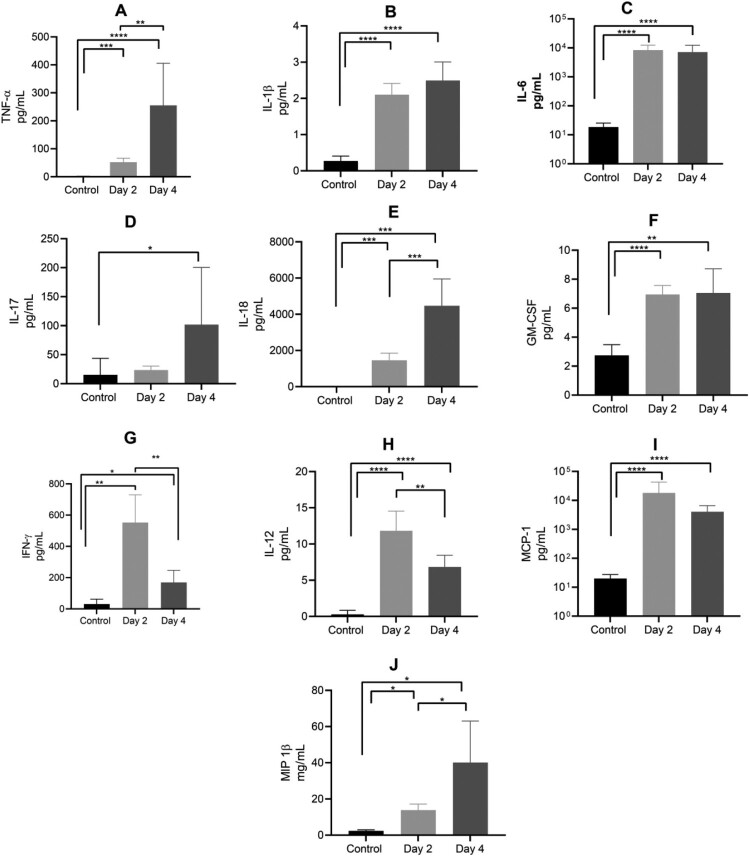
Figure 3.
Plasma cytokine levels in mice infected with AHFV. Mice were infected IP with 1000 LD50 (400 TCID50). Animals were euthanized on 2 or 4 dpi and plasma samples were analyzed for cytokine expression in comparison to uninfected control mice. Results for TNF-α, IL-1β, IL-6, IL-17, IL-18, GM-CSF, IFN-γ, IL-12p40, MCP-1 and MIP-1β are shown. Error bars represent standard deviations. Statistical significance is indicated as follows ****p < 0.0001, ***p < 0.001, **p < 0.01, and *p < 0.05.

