Figure 1.

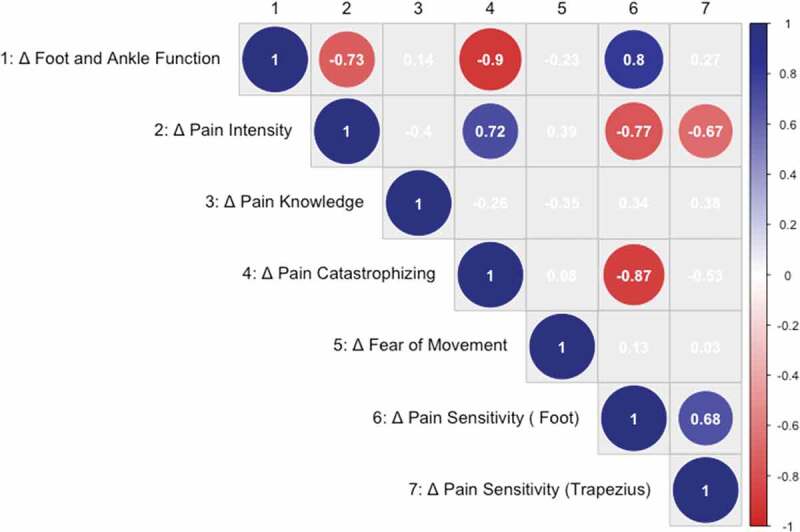
Correlogram depicting associations (p < 0.10) between change in patient-reported outcomes, knowledge of pain neuroscience, psychosocial measures, and pain sensitivity from baseline to 6 weeks. Values are correlation coefficients

Correlogram depicting associations (p < 0.10) between change in patient-reported outcomes, knowledge of pain neuroscience, psychosocial measures, and pain sensitivity from baseline to 6 weeks. Values are correlation coefficients