
Figure 4.
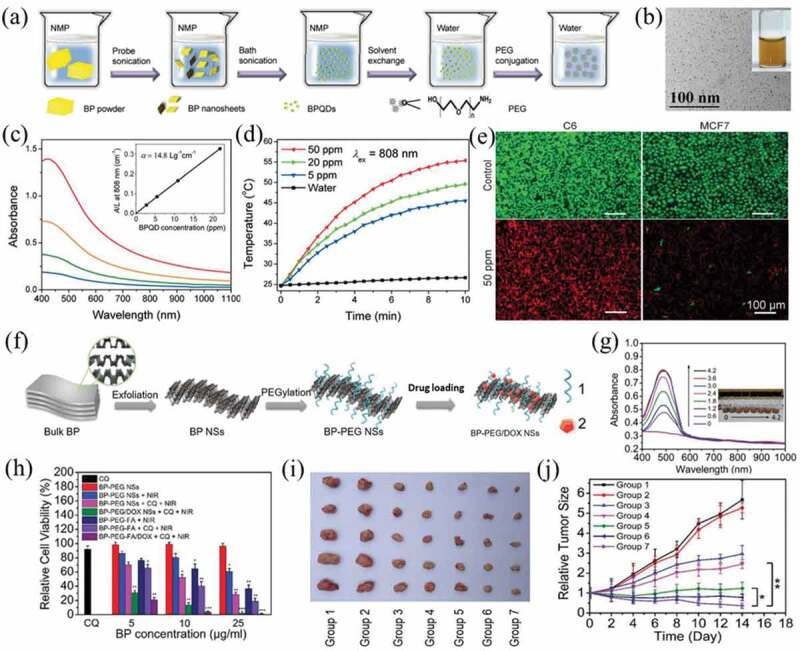
(a) Synthesis and surface modification BPQDs. (b) TEM image and photographs of BPQDs in water. (c) Absorbance spectra of BPQDs dispersed in water at different concentrations. (d) Photothermal heating curves of pure water and BPQDs dispersed in water at different concentrations. (e) Live/dead staining of C6 and MCF7 cancer cells. Reproduced with permission [111]. (f) Schematic representation of the PEGylated BP theranostic delivery platform. 1: PEG-NH2, 2: DOX. (g) Absorbance spectra of BP-PEG/DOX NSs at different concentrations. (h) Relative viability of HeLa cells after different types of treatment with different BP concentrations. (i) Photographs of tumors and (j) inhibition of tumor growth after different treatments. Group 1: saline; Group 2: chloroquine (CQ); Group 3: DOX; Group 4: BP-PEG-FA/DOX; Group 5: BP-PEG-FA+NIR; Group 6: BP-PEG-FA+NIR+CQ; Group 7: BP-PEG-FA/DOX+NIR+CQ. Reproduced with permission [117]