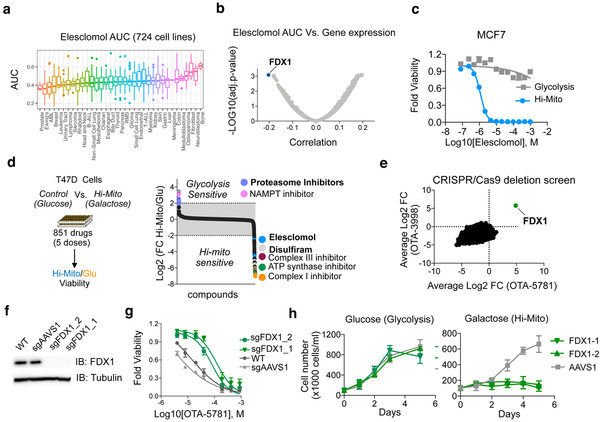
Figure 4. FDX1 is the primary mediator of elesclomol induced toxicity.
a, The viability of 724 barcoded cell lines was determined for 8 concentrations of elesclomol and the calculated area under the curve (AUC) is presented as box plot for different lineages (Supplementary Data 9). b, Correlation analysis of calculated AUC for elesclomol with the gene expression (obtained from the Cancer Dependency Map at www.depmap.org) in 701 cell lines common to both datasets is plotted with the most significant correlation indicated (FDX1 gene) see Supplementary Data 9. c, MCF7 cells were grown in the presence of either glucose (control, gray) or galactose (Hi-Mito, blue) as the carbon source and the relative cell viability was analyzed 72 hours after addition of the indicated concentrations of elesclomol. Mean −/+ SD n= 4 biologically independent samples is plotted d, T47D cells were grown in the presence of either glucose (Glycolysis) or galactose (Hi-Mito) as the carbon source in the presence of compounds from the Selleck anti-cancer L3000 drug library (CDL) (n= 349 in 4 doses) and the natural product library (NPC) (n=502 in 5 doses). The relative viability of the Hi-Mito versus the glycolytic control cells was calculated for replica experiments and the log2 of the ratio is plotted. Specific compounds are annotated. e, The gene scores of two whole genome CRISPR/Cas9-deletion screens conducted with OTA-5781 (100 nM) and OTA-3998 (1uM) treated K562 cells. The gene score is the mean log2 fold change in abundance of all sgRNAs targeting that gene during the culture period. FDX1 is indicated. f, Western blot analysis of FDX1 and tubulin (loading control) protein expression levels in WT K562 cells (WT) or cells with FDX1 (two distinct sgRNAs) and AAVS1 deletions. Representative of two independent experiments. Full length gels are shown in Supplementary Fig. 7. g, Viability curves of parental K562 cells and cells targeted for either AAVS1 (control) or FDX1 achieved with two sgRNAs using CRISPR/Cas9 were treated with increasing concentrations OTA-5781 and viability was examined after 72 hours. h, The indicated cells were grown in the presence of either glucose or galactose (Hi-Mito) and the relative cell number plotted. For g,h mean −/+ SD n= 4 biologically independent samples.

