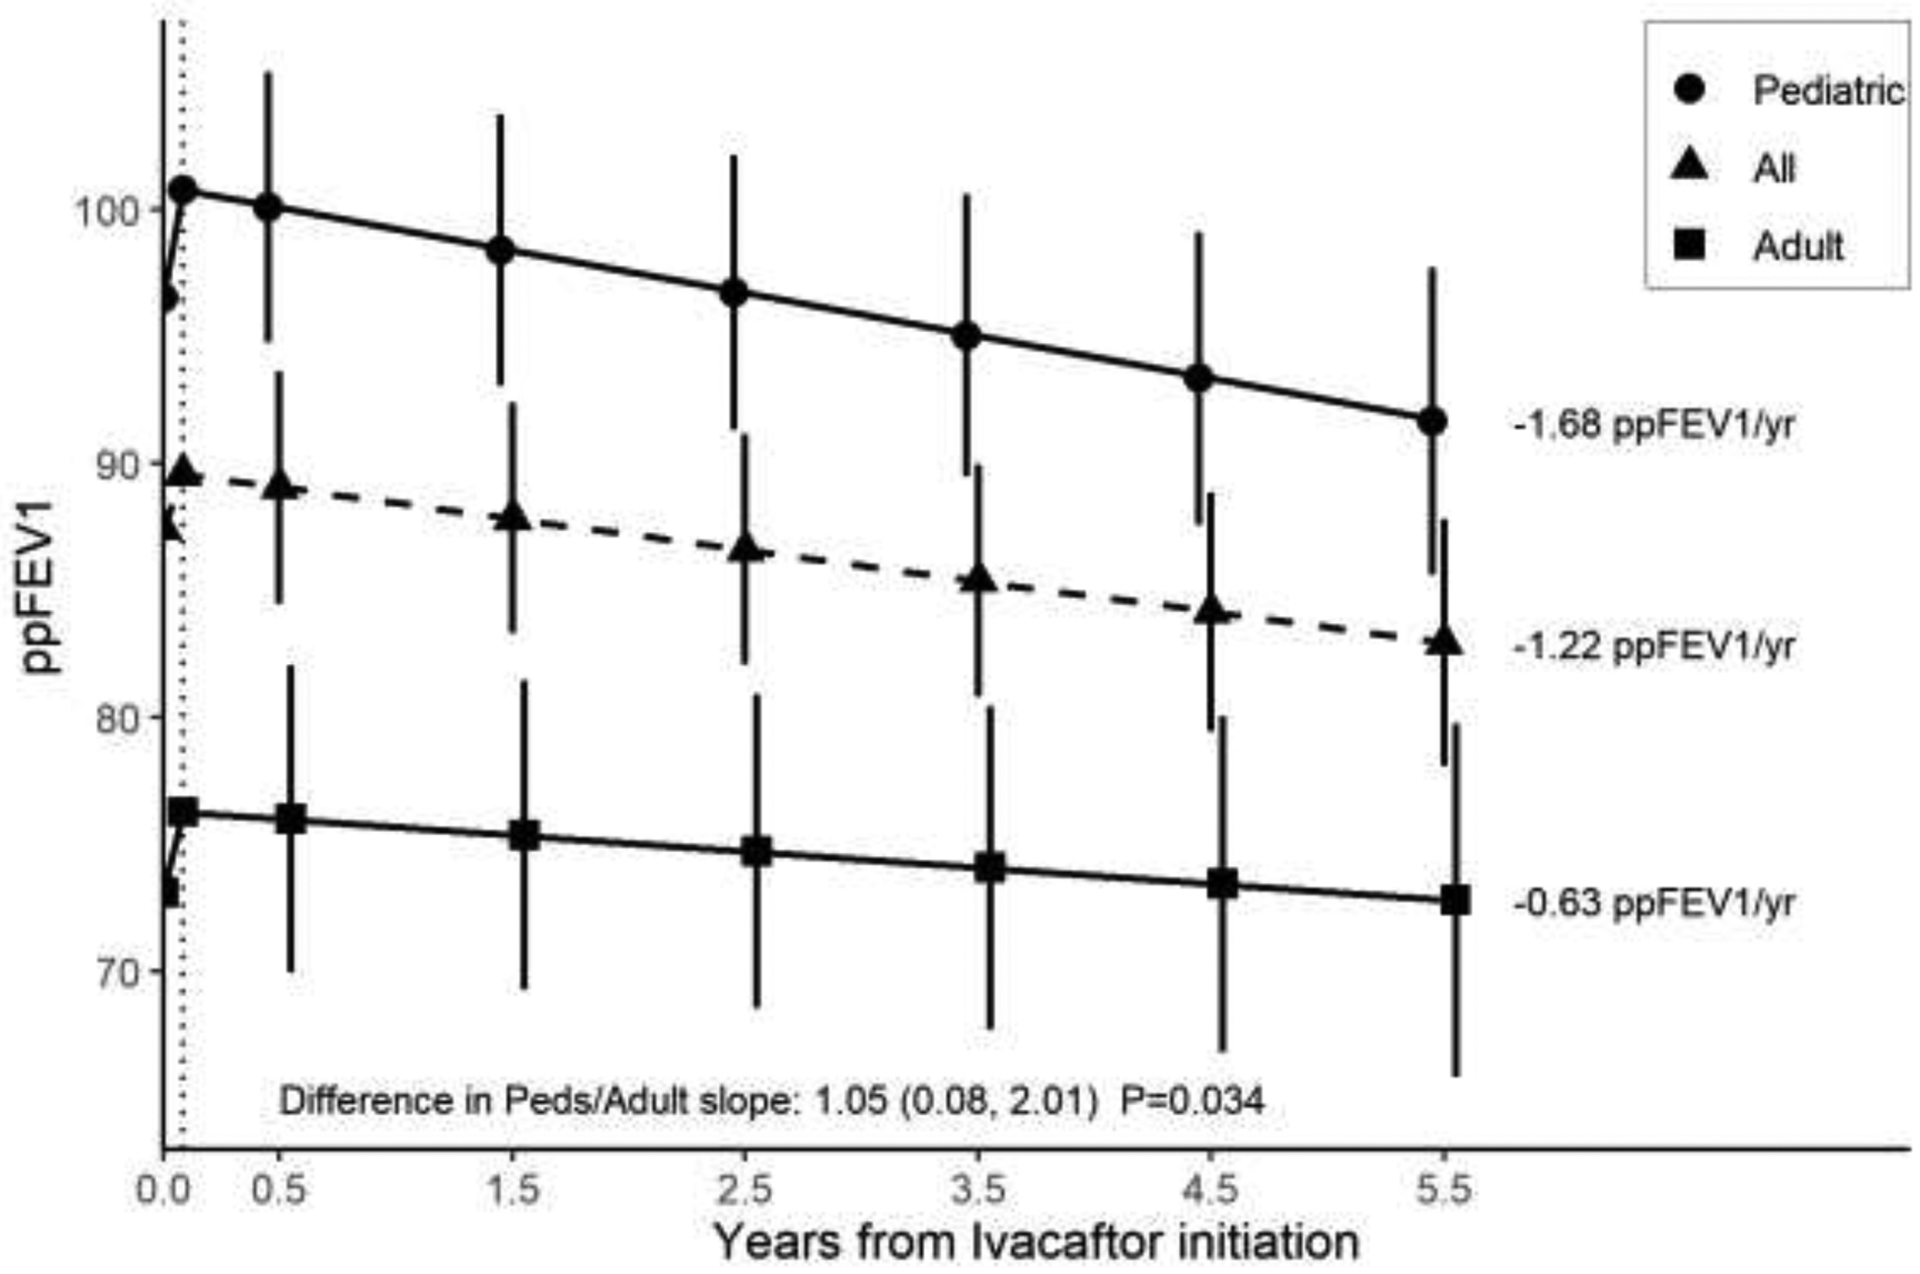
Figure 2. Rate of change over time of ppFEV1.

The annualized rate of decline was stratified by age cohort. The rate of change was calculated from the initial 1-month change (vertical dotted line) through 5.5 years. The rate of change for each group is indicated by the annotations to the right of each line.
