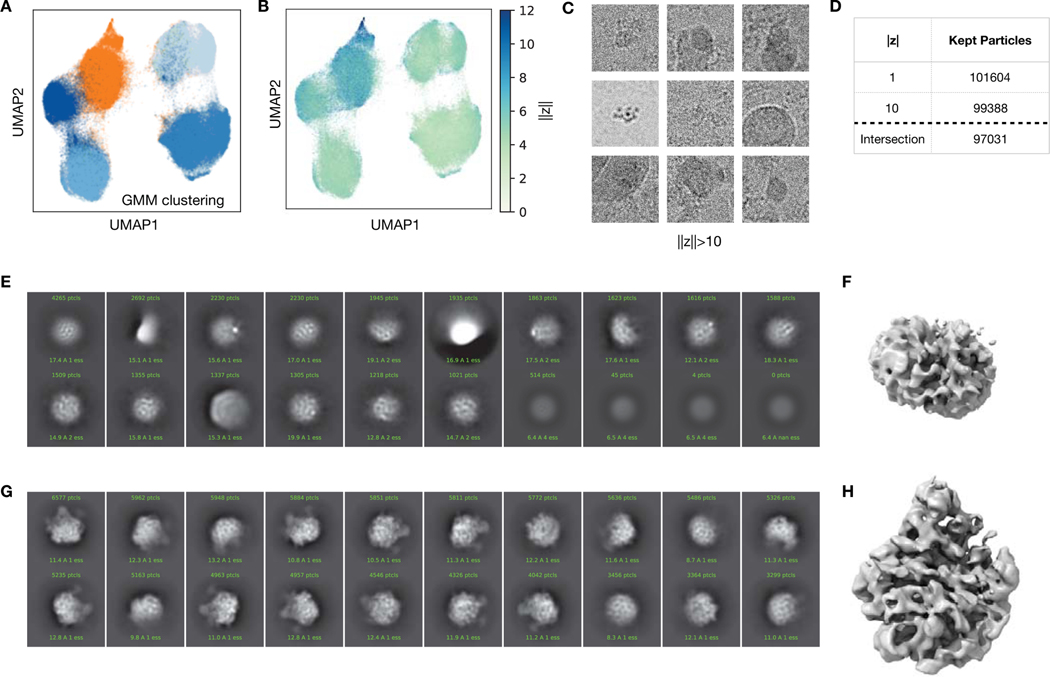
Extended Data Figure 5. Filtering of particles from the assembling ribosome dataset.
A) UMAP visualization of the 10-D latent encodings from cryoDRGN as in Figure 5B, colored by cluster after fitting a 5-component Gaussian mixture model. The cluster that was removed from subsequent analysis is colored orange.
B) UMAP visualization of (A), colored by the magnitude of the latent encodings, ||z||.
C) Nine randomly sampled particle images from EMPIAR-10076 with latent encoding magnitude ||z|| > 10 as predicted from cryoDRGN training in (A,B). Each image is 419.2 Å along each side.
D) Table summarizing dataset filtering.
E,F) 2D classification and ab initio reconstruction of the 34,868 removed particles.
G,H) 2D classification and ab initio reconstruction of the 97,031 kept particles.

