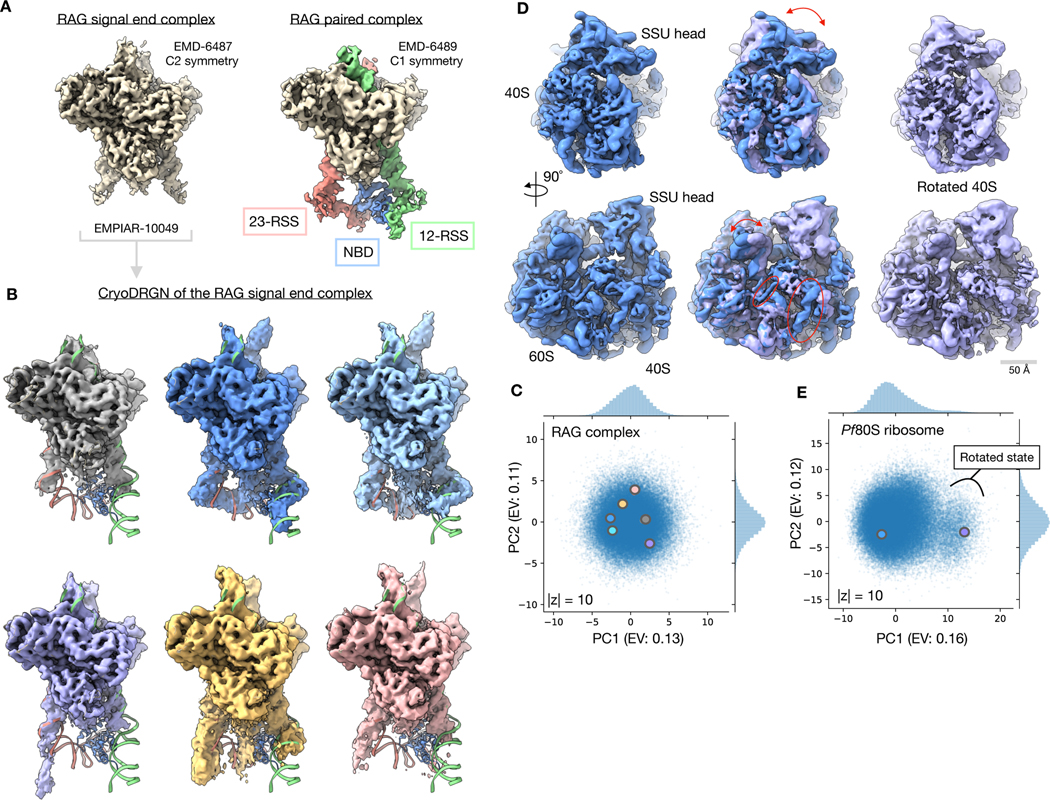
Figure 4. Discovery of residual heterogeneity in “homogeneous” datasets.
A) Published density maps of the 369 kDa RAG1-RAG2 complex. The signal end complex (left) shows the C2 symmetric core and the paired complex (right) resolves additional asymmetric 12- and 23-RSS DNA elements and the RAG-1 nonamer binding domain (NBD) that extend below the core.
B) Representative density maps of the RAG signal end complex (EMPIAR-10049)31 reconstructed by cryoDRGN. Density maps resolve variable conformations of the 12- and 23-RSS DNA elements and the nonamer binding domain (NBD) missing from the homogeneous refinement. Docked atomic model (PDB: 3JBW) of the RAG paired complex includes an asymmetric conformation of the RSS and NBD elements outside of the core RAG complex.
C) Latent space representation of particles images from EMPIAR-1004931, visualized using PCA with explained variance (EV) noted. Structures from (B) are marked with the corresponding color.
D) Density map of the 4.2 MDa Pf80S ribosome (EMPIAR-10028)32 in an unrotated (blue) and rotated (purple) state reconstructed by cryoDRGN. Arrows indicate rotation of the 40S subunit relative to the 60S subunit (top) and motion of the L1 stalk (bottom). Circles indicate differential occupancy of the C-terminal helix of eL8 and an rRNA helix between the two states.
E) Latent space representation of particle images from EMPIAR-1002832, visualized using PCA with explained variance (EV) noted. Structures from (D) are marked with the corresponding color. A cluster of particles separated along PC1 of (D) that corresponds to the rotated state of the Pf80S ribosome is noted.
Additional density maps from these datasets are shown in Extended Data Figure 2 and Supplemental Videos 1 and 2.

