
Figure 5. CryoDRGN heterogeneous reconstruction of the assembly landscape of the bacterial large ribosome subunit.
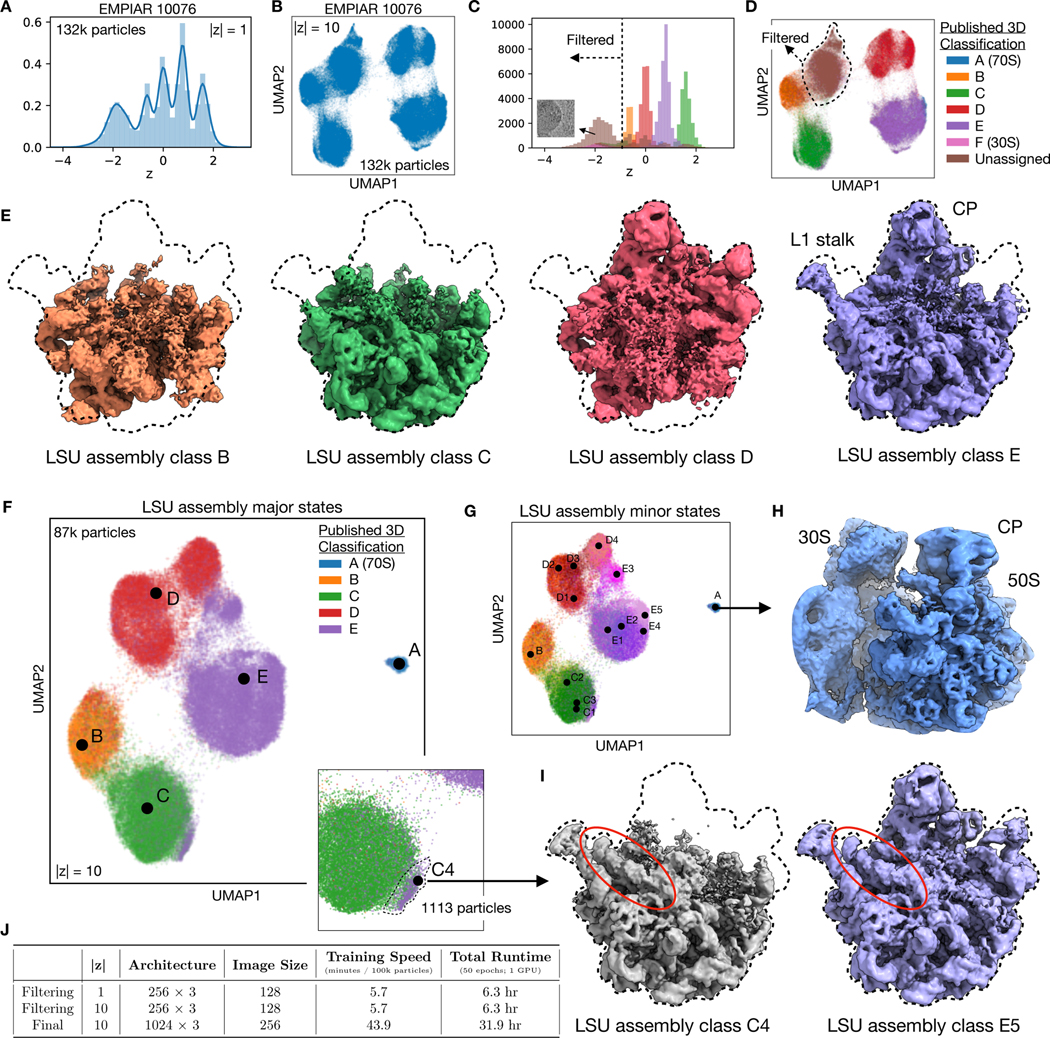
A,B) Latent space representation of particle images of the assembling large ribosomal subunit (LSU) (EMPIAR-10076)12 as a histogram or UMAP embeddings after training a cryoDRGN 1-D and 10-D latent variable model, respectively.
C,D) Latent space representation of particles colored by major LSU assembly state assigned from 3D classification in Davis et al12. Impurities in the dataset were assigned and subsequently filtered based on a cutoff of z = −1 in the 1-D case (dotted line), and cluster assignment from a 5-component Gaussian mixture model in the 10-D case. Dotted line in D indicates rough outline of cluster assignment, shown in Extended Data Figure 4.
E) Density maps reconstructed by cryoDRGN of the four major assembly states of the LSU, after training on the filtered dataset. Dotted line indicates outline of the fully mature 50S ribosome.
F,G) Latent space representation of the filtered dataset, colored by major and minor assembly state assigned from 3D classification in Davis et al12. Points denote cluster centers for the corresponding assembly state. Major assembly state labels correspond to the structures from (E). Inset shows magnified view of the state C cluster, and a population of particles originally mis-classified into state E.
H,I) CryoDRGN reconstruction of additional density maps, showing the 70S ribosome, an impurity during purification, and LSU minor states C4 and E5. Newly identified C4 resembles major state C in maturation, but contains rRNA helix 68, previously present only in mature assembly states E4 and E5.
J) Hyperparameters and runtime of the initial pilot experiments for particle filtering (A-D) and the final cryoDRGN model (E-I) trained on the assembling LSU dataset.
Additional density maps are shown in Extended Data Figure 5 and Supplemental Video 3.