
FIGURE 5.
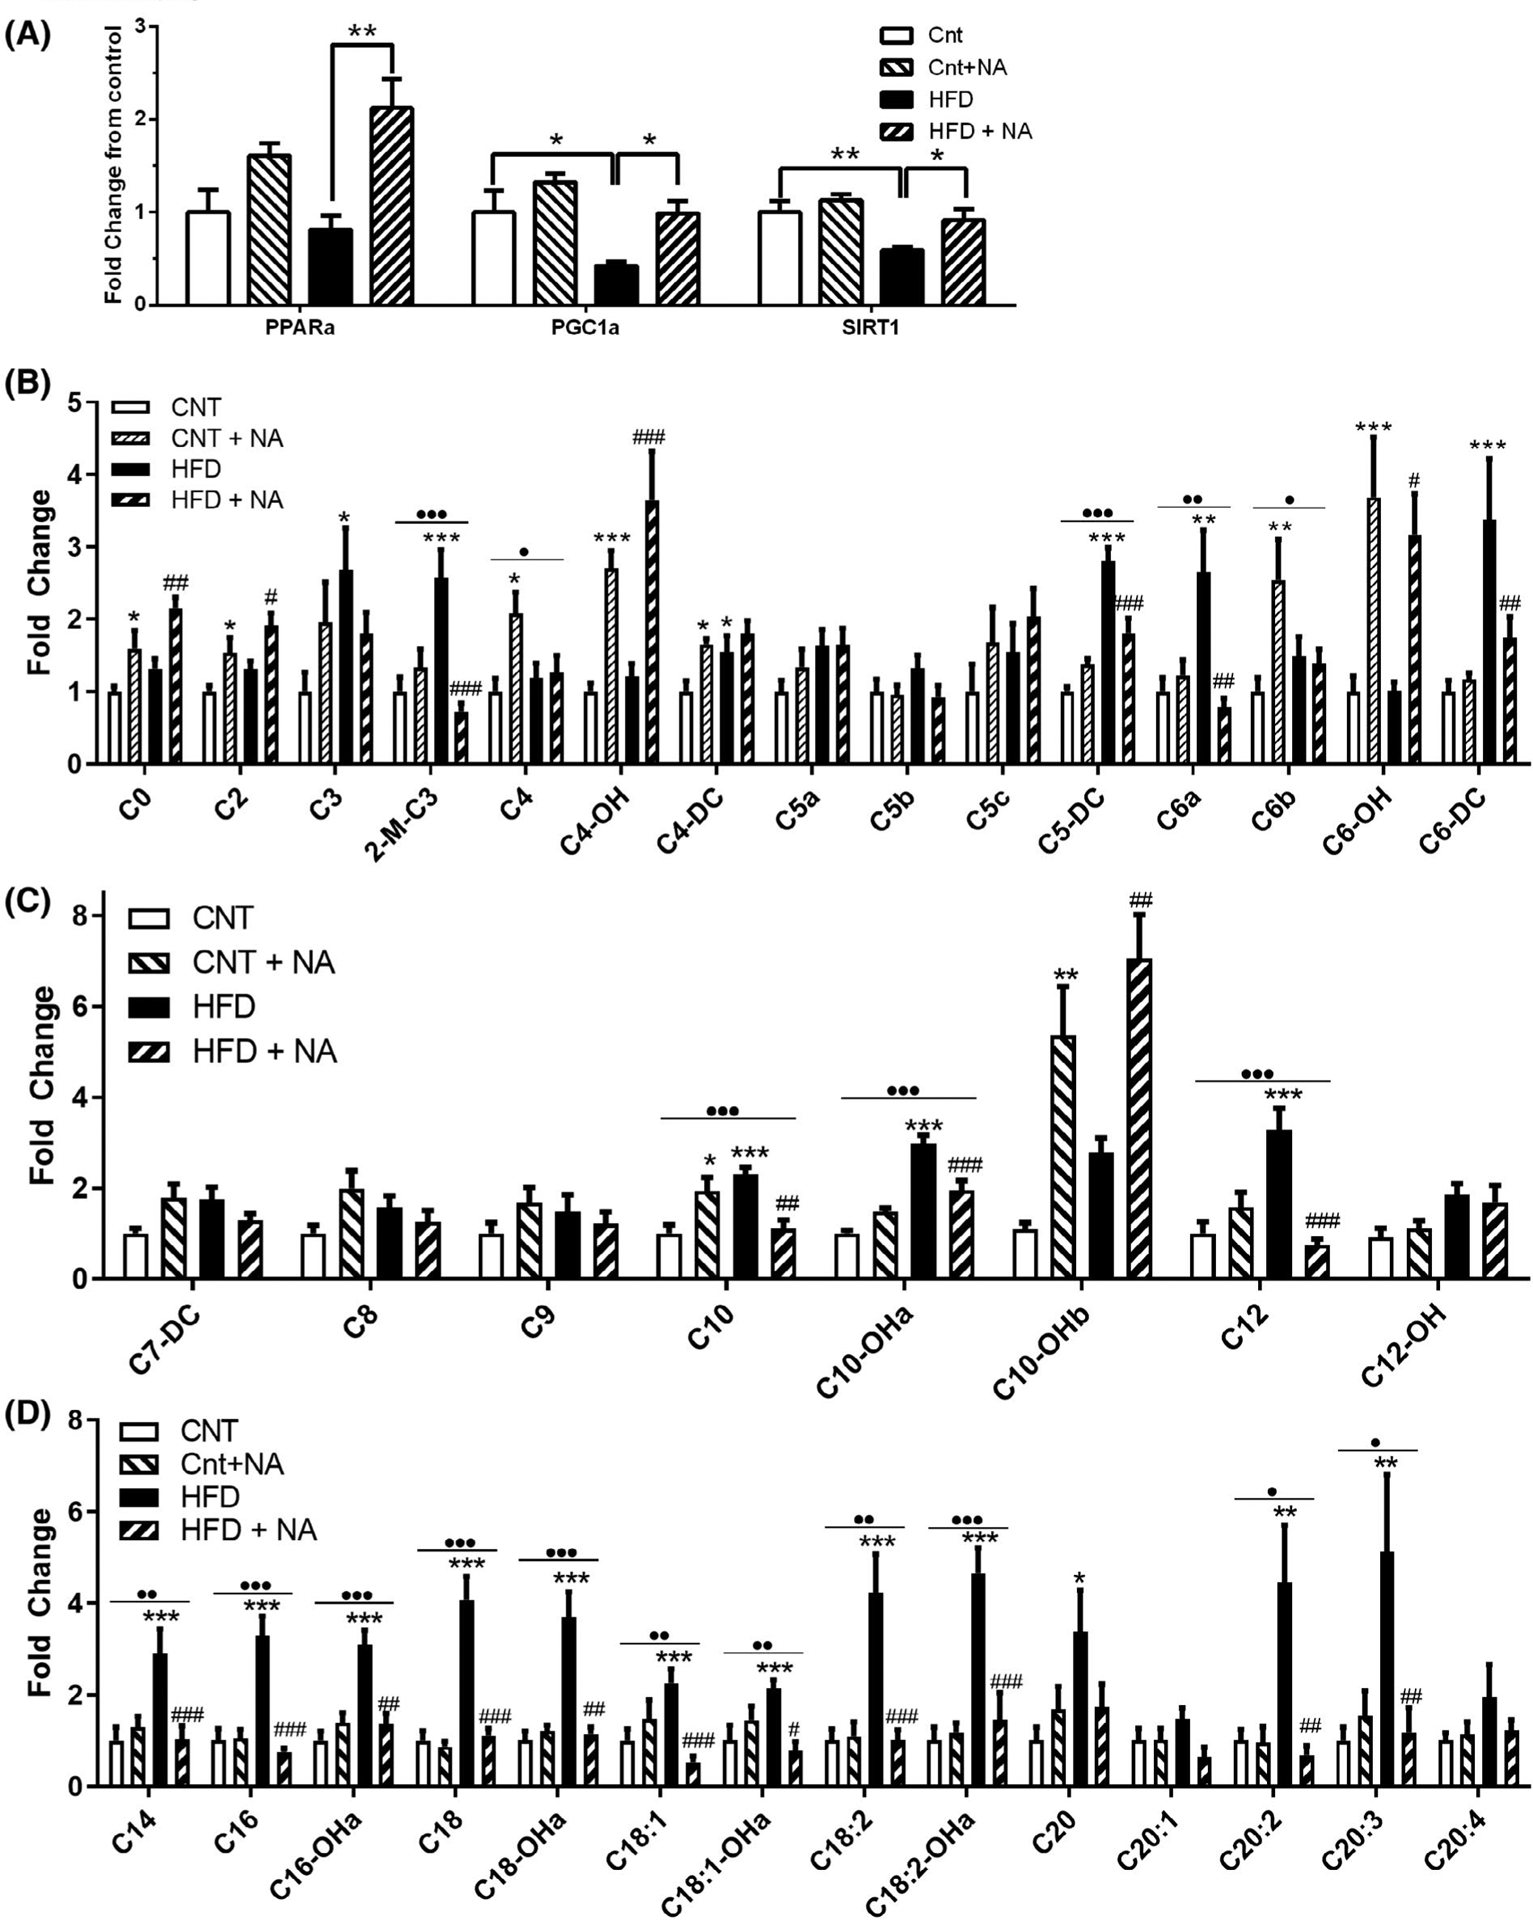
Nervonic acid enrichment improves markers of liver fatty acid oxidation. (A) RT-qPCR was utilized to assess transcript levels of PPARα, PGC1α, and SIRT1 (n = 8 mice/group *P < .05, **P < .01). (B) Short, (C) Medium, and (D) Long-chain acylcarnitine levels were assessed by LC-MS/MS (n = 10–11 mice/group *P < .05, **P < .01, ***P < .001 when compared to control, #P < .05, ##P < .01, ###P < .001 for HFD to HFD + NA comparisons). Where significant, results from two-way ANOVA indicating an interaction between the diet and NA are indicated above each acylcarnitine (•P < .05, ••P < .01, •••P < .001)