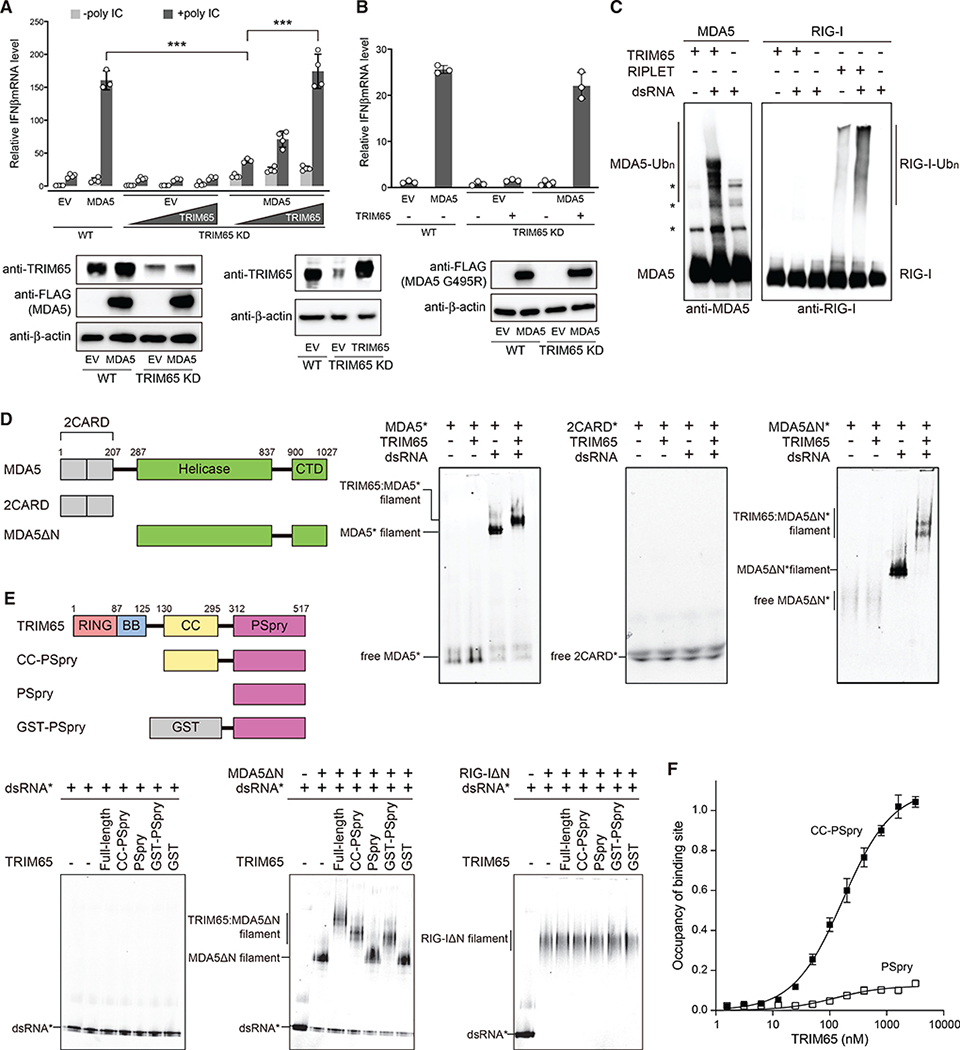
Figure 1. TRIM65 selectively recognizes MDA5 filaments using PSpry bivalency.
(A) Relative signaling activity of MDA5 upon poly(I:C) stimulation (0.5 μg), as measured by IFNβ mRNA induction. The signaling activity was compared in wild-type (WT) and TRIM65 KD 293T cells with and without TRIM65 complementation. Because 293T expresses endogenous MDA5 poorly, cells were transfected with MDA5-expressing vectors. EV, empty vector. For western blotting, the highest amount of TRIM65 complementation was compared with endogenous levels of TRIM65 in WT cells. See STAR methods for experimental details.
(B) Relative signaling activity of MDA5 G495R in WT and TRIM65 KD 293T cells. No exogenous RNA was introduced.
(C) In vitro ubiquitination of MDA5 and RIG-I (500 nM) using TRIM65 or RIPLET (250 nM) in the presence and absence of dsRNA (2 ng/μL). 1,012-bp and 112-bp dsRNAs were used for MDA5 and RIG-I, respectively, because the two receptors prefer different lengths of dsRNA for filament formation and immune stimulation. The Ubc13:Uev1a complex was used as E2. Reactions were analyzed by SDS-PAGE, followed by anti-MDA5 and anti-RIG-I immunoblots.
(D) Native gel mobility shift assays to monitor MDA5:TRIM65 interaction. Fluorescein-labeled (*) full-length MDA5, 2CARD, or MDA5ΔN (600 nM) were incubated with TRIM65 (300 nM) in the presence and absence of dsRNA (4 ng/μL). We used 112-bp dsRNA instead of 1,012-bp dsRNA to clearly visualize the mobility shift upon TRIM65 binding. Fluorescein fluorescence was used for gel imaging.
(E) Native gel mobility shift assays to monitor MDA5:TRIM65 interaction with TRIM65 domain mutants. Filaments of MDA5ΔN or RIG-IΔN (250 nM) were formed on Cy5-labeled (*) 112-bp dsRNA (1 ng/μL) and incubated with TRIM65 or its truncation variants (300 nM).
(F) Quantitative analysis of the mobility shift assay in Figure S1H, which showed that TRIM65 CC-PSpry has a KD of 170.6 nM. The KD could not be determined for PSpry because of inefficient mobility shift at all concentrations tested.
All data are representative of at least three independent experiments. Data in (A), (B), and (F) are mean ± SD (n = 3–4), and p values were calculated by two-tailed t test (***p < 0.001, **p < 0.005).
See Figure S1.

