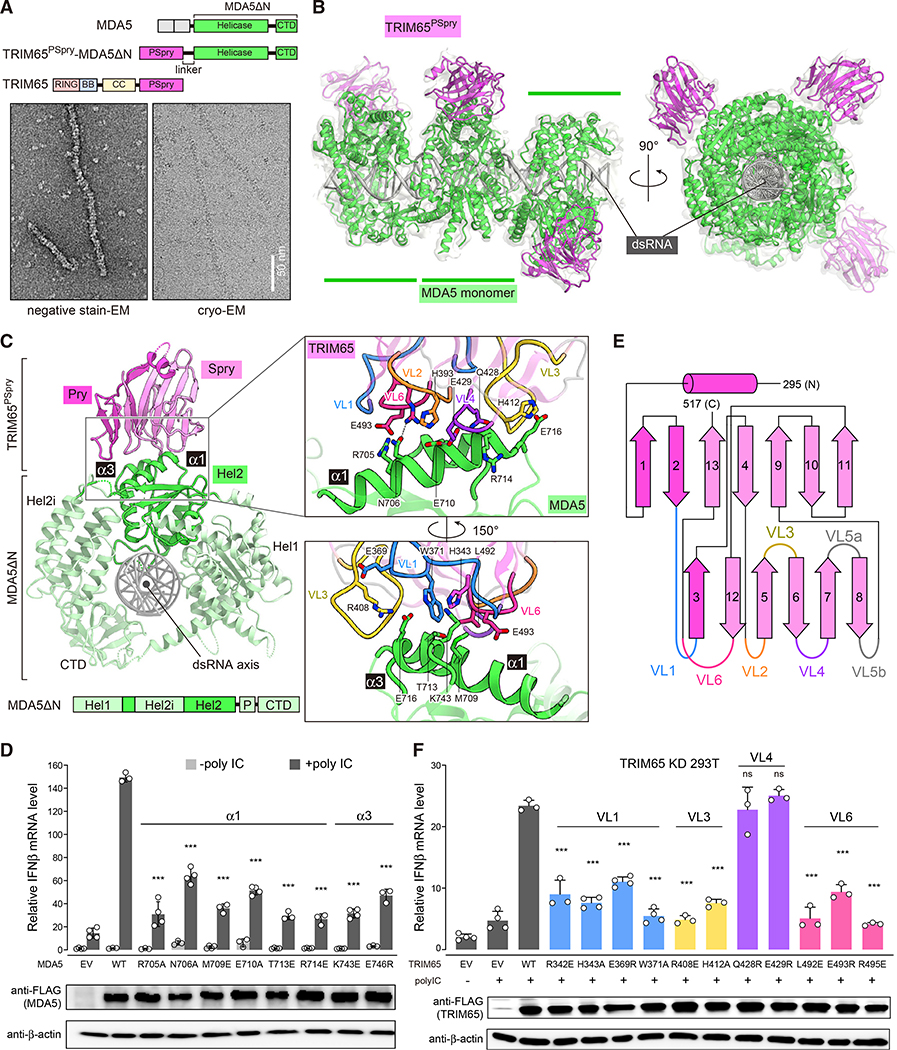
Figure 2. TRIM65 PSpry recognizes α1/α3 of MDA5 Hel2.
(A) Top: schematic of the TRIM65PSpry-MDA5ΔN fusion construct. Bottom: representative negative-stain EM (left) and cryo-EM (right) of filaments formed by TRIM65PSpry-MDA5ΔN on 1,012-bp dsRNA.
(B) Cryo-EM map and ribbon model of the trimeric segment of the TRIM65PSpry-MDA5ΔN fusion filament. The cryo-EM map was low pass filtered at 5-A resolution and shown at 50% transparency. TRIM65PSpry, MDA5ΔN, and dsRNA are colored magenta, green, and gray, respectively. See also Figure S2 and Table 1 for details.
(C) Top view of the central monomeric complex of MDA5ΔN:TRIM65PSpry. Subdomains of MDA5ΔN are colored according to the schematic below. Note that part of Hel2 is separated by the Hel2 insertion (Hel2i) domain. “P” indicates the pincer domain. The Pry and Spry domains of TRIM65PSpry are colored magenta and pink, respectively. Right: magnified views of the interface between TRIM65PSpry and MDA5ΔN, where relevant variable loops (VLs) of TRIM65PSpry are colored according to the secondary structure schematic in Figure 2E. Key interacting residues are shown in stick models.
(D) Relative signaling activity of MDA5 with or without mutations in the TRIM65PSpry binding interface as measured by IFNβ mRNA induction. 293T cells were transfected with MDA5-expressing vectors and stimulated with poly(I:C) (0.5 μg). The amount of MDA5-expressing vector for each mutant was adjusted to ensure that the expression level is equivalent to WT.
(E) Secondary structure representation of TRIM65PSpry and definition of VLs. The Pry and Spry subdomains are distinguished by magenta and pink colors, respectively.
(F) Relative signaling activity of WT MDA5 upon poly(I:C) (0.5 μg) stimulation, as measured by IFNβ mRNA induction. TRIM65 KD 293T cells were transfected with plasmids expressing WT or mutant TRIM65. The amount of TRIM65-expressing vector for each mutant was adjusted to ensure that the expression level is equivalent to the WT. All cells were transfected with equal amounts of WT MDA5.
Data in (D) and (F) are mean ± SD (n = 3–4), and p values were calculated by comparing with the WT value using two-tailed t test (***p < 0.001; ns, not significant, p > 0.1). See Figures S2 and S3.

