Figure 3.
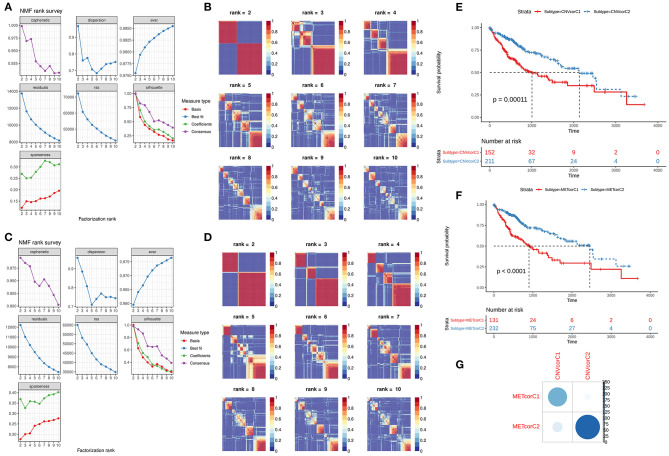
Identification of molecular subtypes according to CNVcor and METcor genes. (A,B) NMF cluster analysis based on CNVcor genes. (C,D) NMF cluster analysis based on METcor genes. Kaplan-Meier curve analysis of CNVcor gene clusters (E) and METcor gene clusters (F). (G) Overlap between CNVcor and METcor gene clusters. The color shade indicates the number of overlapping specimens.

