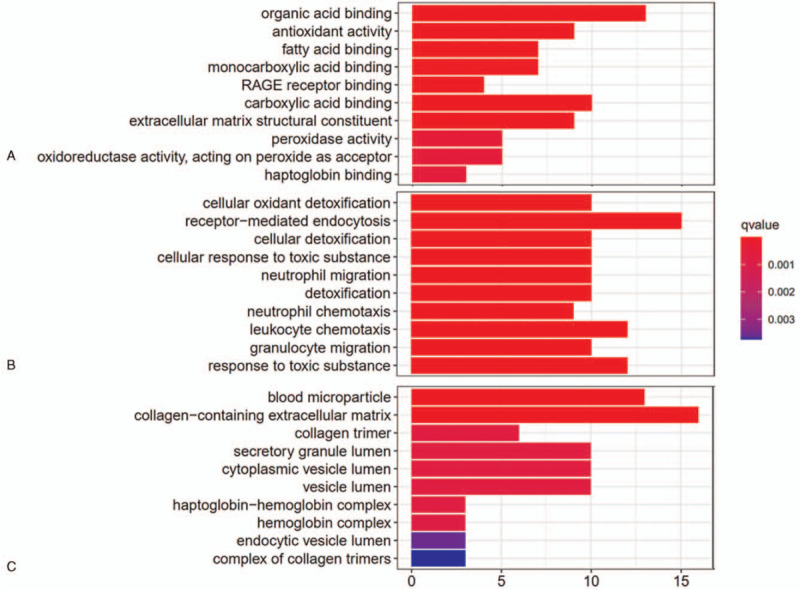
Figure 3.

The gene ontology (GO) enrichment analysis of the DEGs in DKD in the training dataset GSE96804. The GO analysis of the DEGs from the aspects of MF (A), BP (B), and CC (C) with significant enrichment (top 10). Color of the bar chart indicates q value, and x axis indicates count of the DEGs in the GO function items. BP = biological processes, CC = cell components, MF = molecular functions.
