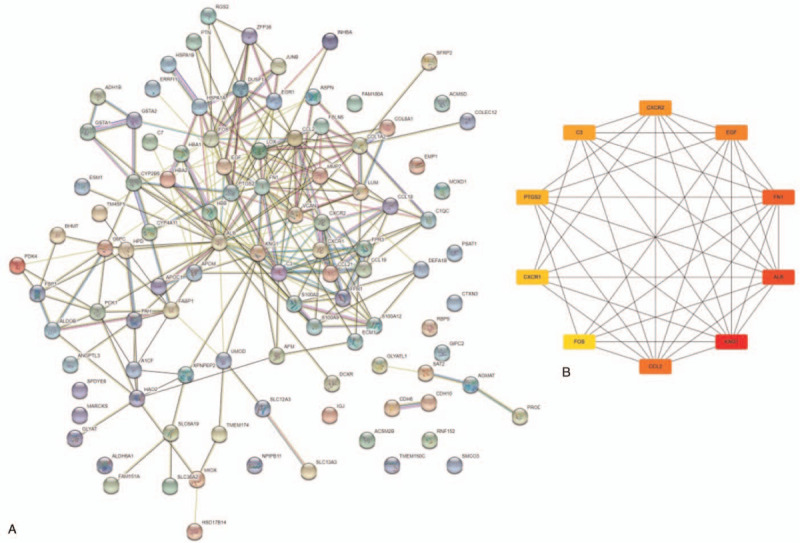
Figure 4.

The protein-protein interaction (PPI) network analysis in the training dataset GSE96804. (A) The PPI network of the DEGs in DKD. (B) The PPI network of the hub genes in DKD. Network nodes indicate proteins, and edges indicate PPI. Darker color represents a higher level of interaction, and lighter color represents a lower level of interaction.
