
Figure 1.
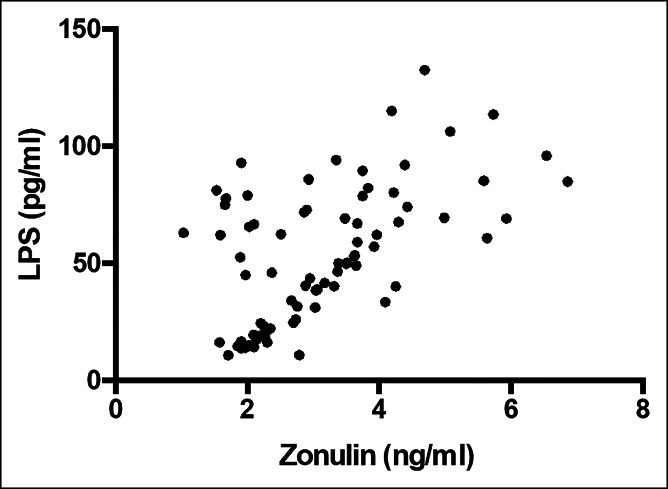
Scatter plot showing significant (2-tailed) Spearman positive correlation of zonulin in horizontal vs vertical directions of LPS concentration.
Official websites use .gov
A
.gov website belongs to an official
government organization in the United States.
Secure .gov websites use HTTPS
A lock (
) or https:// means you've safely
connected to the .gov website. Share sensitive
information only on official, secure websites.
Scatter plot showing significant (2-tailed) Spearman positive correlation of zonulin in horizontal vs vertical directions of LPS concentration.