
Figure 1.
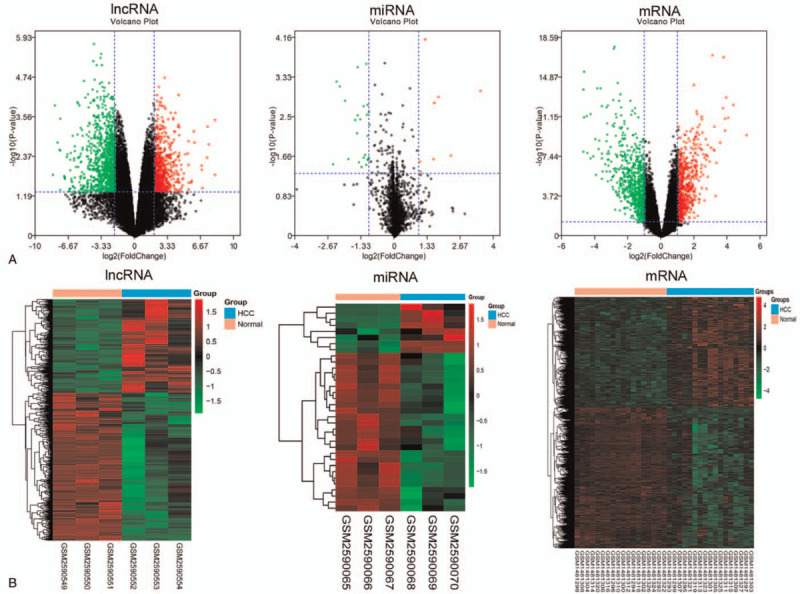
Identification of significant expression changes in RNAs in HCC. A Volcano plot for the DElncRNAs and DEmiRNAs in GSE98269 and DEmRNAs in GSE60502. The black dots represent genes that are not differentially expressed between the HCC samples and normal samples, and the green dots and red dots represent the downregulated and upregulated genes, respectively, in HCC samples. B Heatmap of the DElncRNAs and DEmiRNAs in GSE98269 and DEmRNAs in GSE60502. Genes expressed at high levels are shown in red, and genes expressed at low levels are shown in green.