Figure 6.

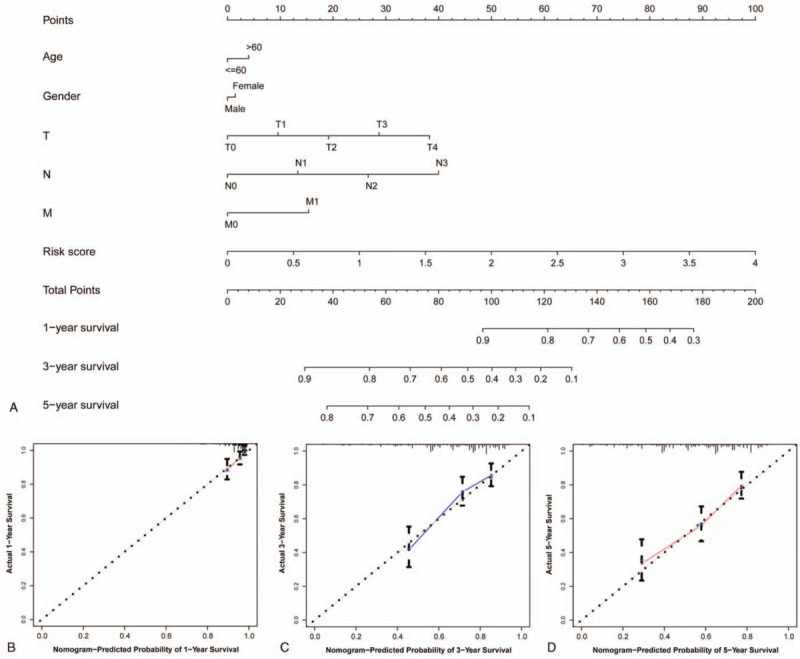
Construction and validation of a predictive nomogram. (A) A nomogram was constructed to predict 1-, 3-, and 5-year events (mortalities). (B–D) The calibration plot for internal validation of the nomogram.

Construction and validation of a predictive nomogram. (A) A nomogram was constructed to predict 1-, 3-, and 5-year events (mortalities). (B–D) The calibration plot for internal validation of the nomogram.