
Figure 8.
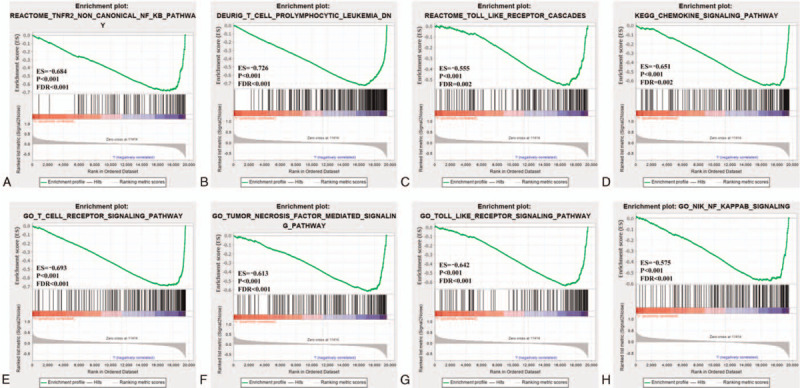
GSEA enrichment between the high-risk and low-risk groups. GSEA results for the (A–D) c2-reference and (E–H) c5-reference gene sets for the low-risk group. ES = enrichment score, FDR = false discovery rate, GSEA = gene set enrichment analysis.