
Figure 8.
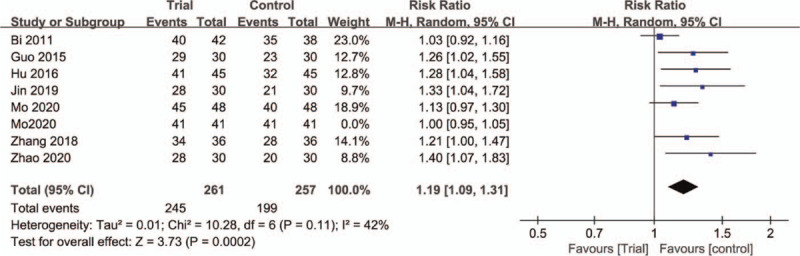
Forest plots of comparison of effective rate between trial group and control group. “—”” represents the excluded study.[31]
Official websites use .gov
A
.gov website belongs to an official
government organization in the United States.
Secure .gov websites use HTTPS
A lock (
) or https:// means you've safely
connected to the .gov website. Share sensitive
information only on official, secure websites.
Forest plots of comparison of effective rate between trial group and control group. “—”” represents the excluded study.[31]