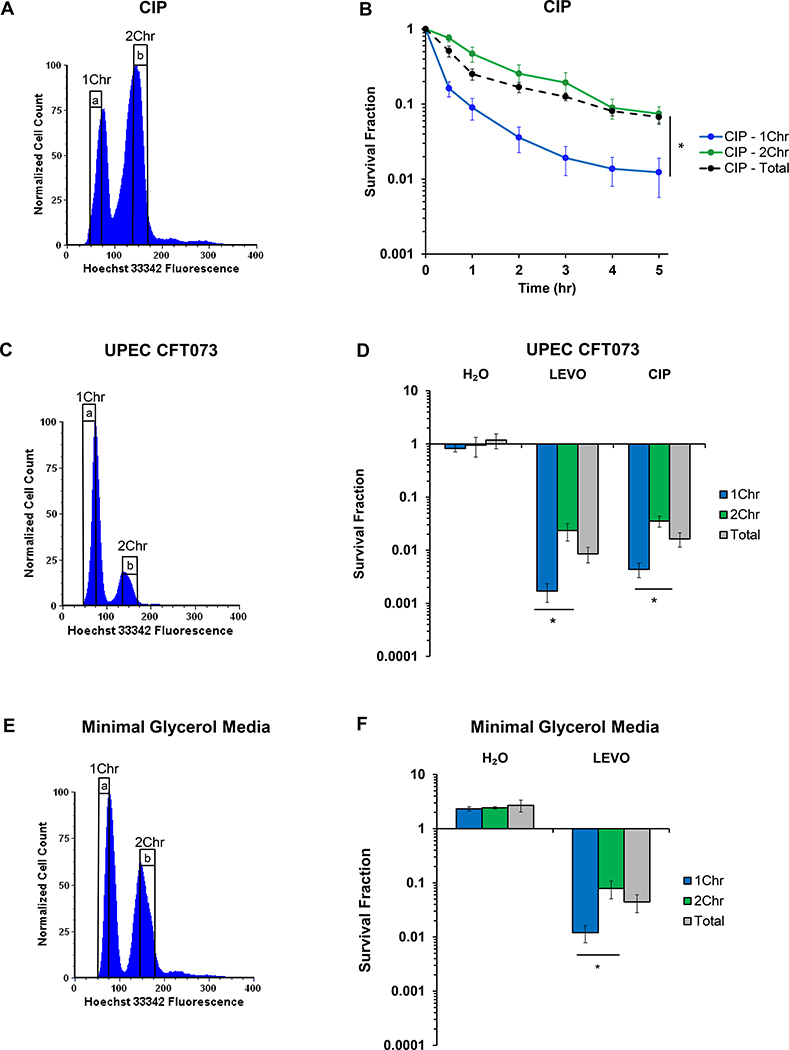
Figure 3. Ploidy dependence extends to ciprofloxacin, UPEC, and different growth conditions.
(A) Representative DNA histogram of stationary-phase wild-type E. coli stained with 5 μg/mL Hoechst 33342. (B) Cells that were FACS-sorted to contain 2Chr exhibit >6-fold higher survival when treated with 1 μg/mL CIP than cells harboring 1Chr (n = 5). Statistical significance was initially determined using a one-way ANOVA (F(2,12) = 16.0, p < 0.001) at the 5 h timepoint. Tukey HSD post-hoc test showed a significant difference at 5 h when comparing the means of 1Chr vs. 2Chr (p = 0.0008) and 1Chr vs. Total Sort (p = 0.0012). (C) Representative DNA histogram of uropathogenic E. coli strain CFT073 (UPEC) grown to stationary phase and stained with 5 μg/mL Hoechst 33342. (D) UPEC harboring 1Chr were >13-fold or >8-fold less likely to survive 5 μg/mL LEVO (n = 7) or 1 μg/mL CIP (n = 6) treatment, respectively, than cells harboring 2Chr. Statistical significance was initially determined using a one-way ANOVA (LEVO: F(2,18) = 4.4, p < 0.03; CIP: F(2,15) = 4.1, p < 0.04). Tukey HSD post-hoc test showed a significant difference when comparing the means of 1Chr vs. 2Chr for both the LEVO (p = 0.023) and CIP (p = 0.031) treatments. (E) Wild-type E. coli was grown to stationary phase in minimal media with 20 mM glycerol as the sole carbon source and stained with 5 μg/mL Hoechst 33342 to determine genomic content. (F) Cells grown in minimal glycerol media and sorted to have 2Chr were >6-fold more likely to survive treatment with 5 μg/mL LEVO than cells sorted to have 1Chr (n = 3). Statistical significance was initially determined using a one-way ANOVA (F(2,6) = 7.0, p < 0.03). Tukey HSD post-hoc test showed a significant difference when comparing the means of 1Chr vs. 2Chr (p = 0.024). Biphasic kill curves of UPEC treated with 5 μg/mL LEVO or 1 μg/mL CIP and wild-type E. coli grown in minimal glycerol media and treated with 5 μg/mL LEVO can be found in Figure S3. See also Figures S2 and S3. 1Chr and 2Chr indicate chromosome number as determined by experiments in Figure 2. Representative gating strategy is indicated by a and b. Error bars portray ± SEM. All replicates were independent biological replicates. * indicates statistical significance.

