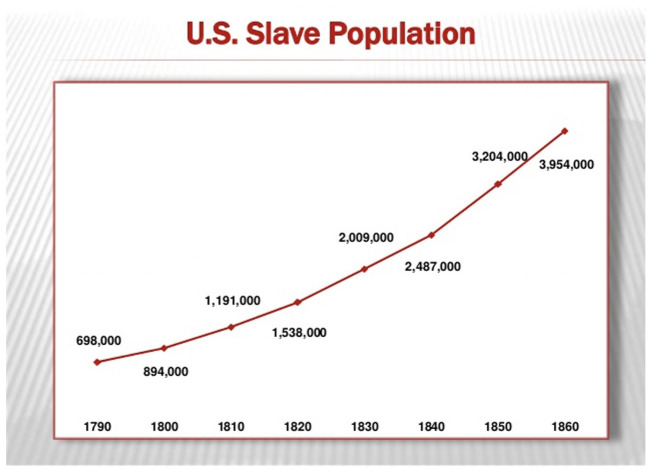
Figure 1.
Trajectory of the Slave Population in the United States (U.S.) from 1790 until 1860. This figure used with permission from (copyleft 2007) Chad David Cover. Data derived from “Series A 119–134. Population by Age, Sex, Race, and Nativity: 1790–1970.” U.S. Bureau of the Census, Historical Statistics of the United States, Colonial Times to 1970. Bicentennial Edition, Part 2. Washington, D.C., 1975.

