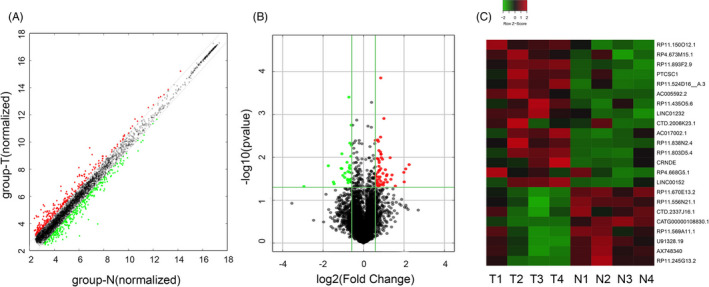
FIGURE 1.

SE‐LncRNA microarray analysis of CRC tissues. A, The scatter plot displayed variation in SE‐LncRNA expression between group‐N (normal) and group‐T (CRC). B, The volcano plot represented the fold change values and P‐values of the microarray data. C, Hierarchical clustering revealed differentially expressed SE‐LncRNAs (fold change >2, p‐value <0.05). Red and green colors represented upregulated and downregulated SE‐LncRNAs, respectively
