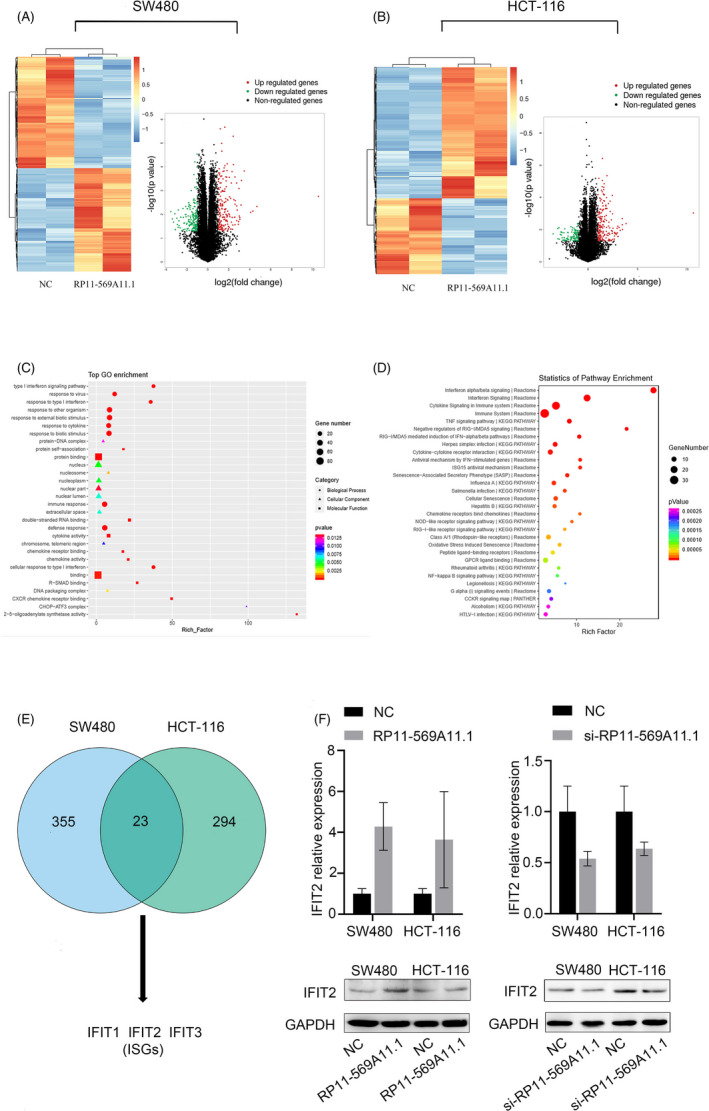
FIGURE 6.

RP11‐569A11.1 positively regulated IFIT2 expression in CRC cells. A‐B, Hierarchical clustering and volcano plot revealed the altered genes with statistical significance in SW480 group and HCT‐116 group. C, The Gene Ontology (GO) analysis of these altered genes from three aspects: biological process (BP), cellular component (CC), and molecular function (MF). D, The top enriched signaling pathways of these altered genes were analyzed by KEGG pathway. E, The intersection of 378 dysregulated genes in SW480 cell group with 317 dysregulated genes in HCT‐116 cell group. F, RT‐qPCR and Western blot assays were performed to detect the RNA and mRNA expression of IFIT2. * p < 0.05 and ** p < 0.01
