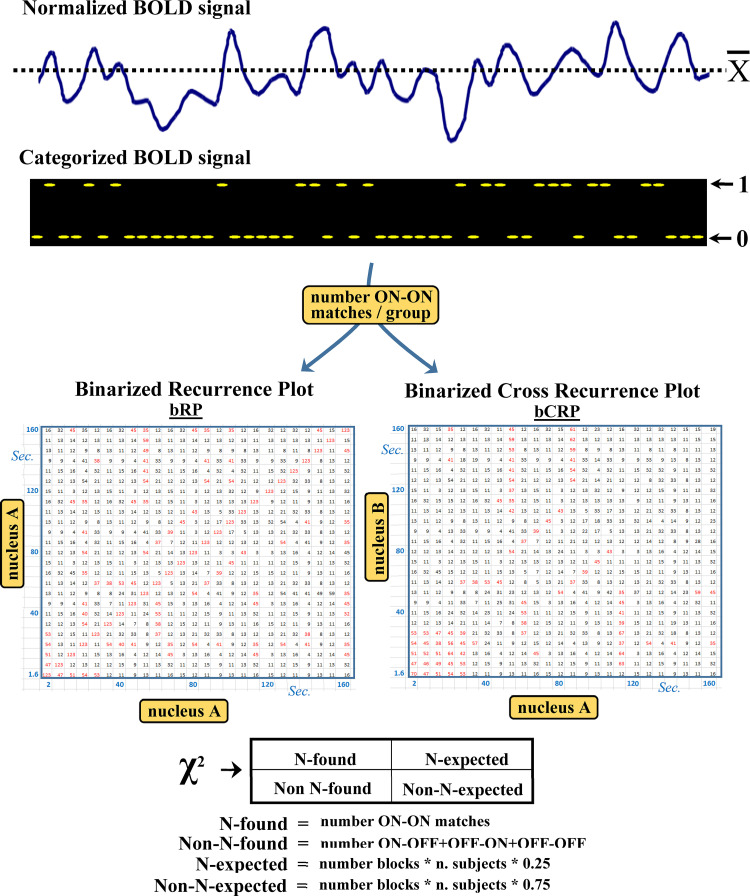
Fig 1. The binarized recurrence plot (bRP) and binarized cross recurrence plot (bCRP) methods.
BOLD data are normalized as percentages of the mean BOLD-value of each subject (A) and binarized by replacing the data higher than the mean value with the number 1 (which represent a status of high-metabolic activity) and those lower or equal to the mean value with the number 0 (low metabolic activity) (B). The next step is to calculate the number of 1–1 matches (ON-ON matches) for the bRP and bCRP. The bRP computes the ON-ON match matrix of each task-block of each subject (ON-ON matches of each time-point regarding all the time-points of the same block). This is a 100x100 matrix whose elements can be 1 (ON-ON match) or 0 (ON-ON mismatch). The bRP was computed by adding the two ON-ON match matrices of the same experimental-block of each subject to those of all the other subjects of the experimental group (C). Thus, each of the 100x100 elements of the bRP have a value between 0 (no ON-ON matches) and 40 (the 20 subjects of each group showed ON-ON matches in both task-blocks). The bCRP was computed with the same procedure but using the ON-ON matches of a particular brain region with those recorded in another brain region (D). Thus, whereas the bRP shows the time-dynamic of a brain region, the bCRP shows the time-dynamic of the relationship between two brain regions. The statistical significance (D) of each value of the bRP and bCRP matrices was computed with a Chi2 test. The bRP and bCRP values are between 0 and 40 and each of the four possible combinations of the ON and OFF status should be found 25% of times. The distance between the expected and found numbers of ON-ON matches was established using the Chi2 distribution, and only values with a Chi2 probability lower than 0.01% were considered.

