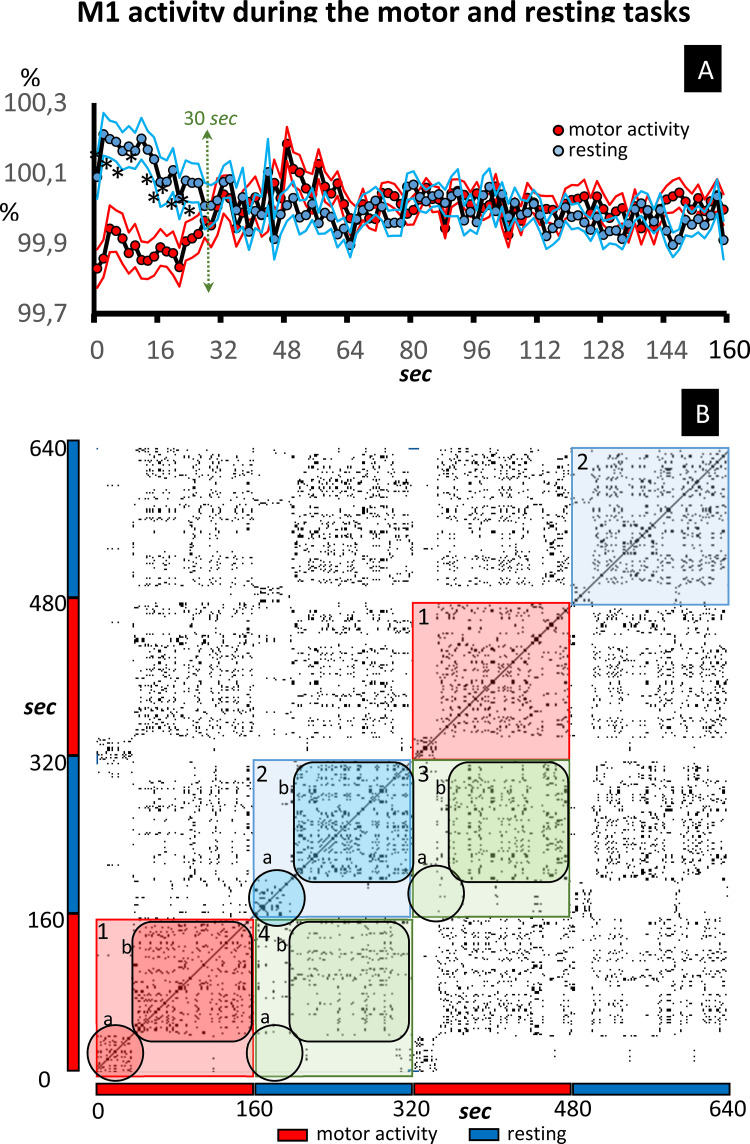
Fig 2. Recurrence plot of the M1 activity.
Fig 2A shows the mean ± standard error of the BOLD signal (data normalized as a percentage of the mean value of each subject) recorded in the M1 of control subjects. The data recorded during the motor-task block are shown in red (grouping the 1–160 sec and 320–480 sec time-intervals). The data recorded during the resting-task block are shown in blue (grouping 160–320 sec and 480–640 sec time-intervals). Fig 2B shows a typical RP example of the M1 dynamic in control subjects. The identity line is the diagonal line which goes from the bottom-left to the top-right. The checkerboard distribution shows the limits that coincide with the task-transitions (1: motor-block and 2: resting-block). The points included in squares 3 and 4 show the functional link between the motor-block and the resting block. The initial and late responses of each block are indicated by the letters a and b, respectively.

