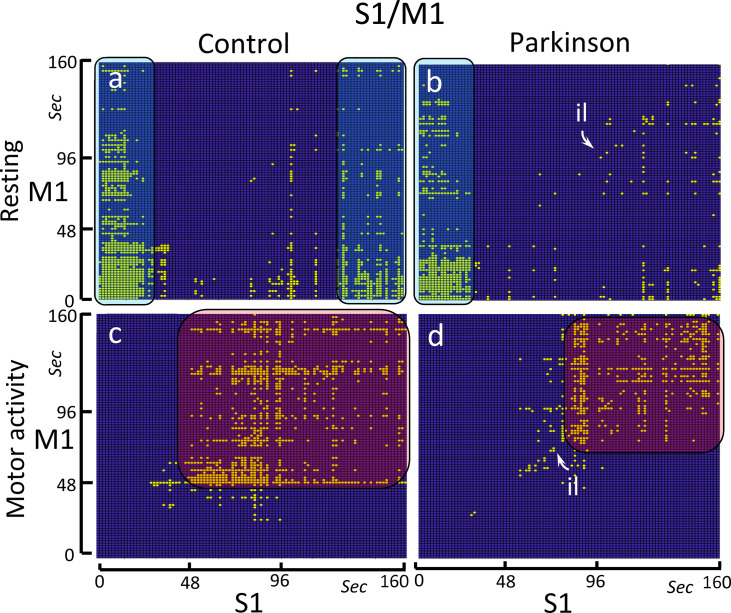
Fig 4. Binarized cross recurrence plot of the S1-M1 functional connectivity.
Images show the significant ON-ON matches of S1-M1 in the control group (left-side) and PD patients (right-side), and during resting-task (top) and the motor-task (bottom). The control group shows a high-density ON-ON match at the beginning (0–25 sec) and at the end (130–160 sec) of the resting-task block (Fig 4A), and between the 45–160 sec of the motor-task block (Fig 4C). The PD group shows an identity line (il) which is particularly evident during the motor-task block (Fig 4D). In this group, the high-density ON-ON match at the end (130–160 sec) of the resting-task block vanished (Fig 4B) and the amplitude of the ON-ON match during the motor-task block decreased (Fig 4D).

