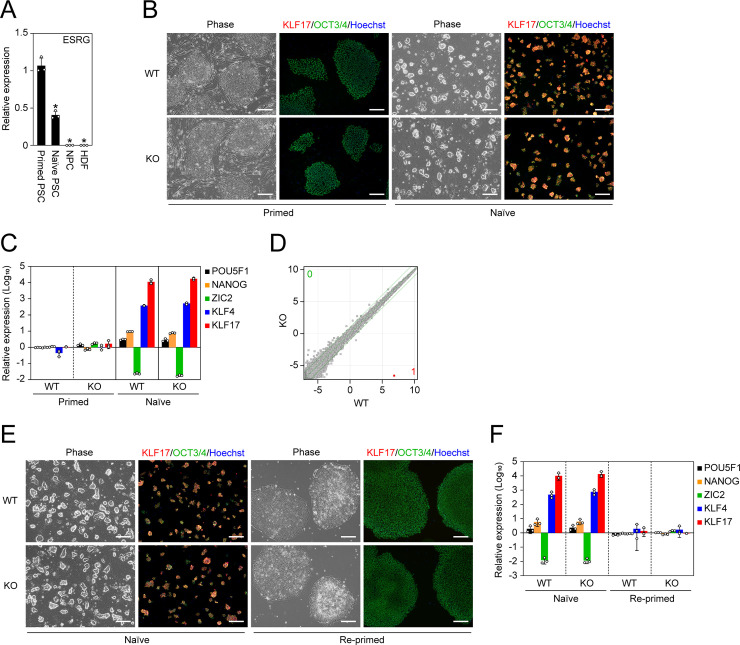
Fig 3. No impact of ESRG on naïve pluripotency.
(A) The ESRG expression. Shown are relative expressions of ESRG in primed PSCs, naïve PSCs, NPCs and HDFs. Values are normalized by GAPDH and compared with the primed 585A1 iPSC line. *P<0.05 vs. primed PSCs by unpaired t-test. n = 3. (B) Conversion to naïve pluripotency. Shown are representative images of ESRG WT and KO primed and naïve PSCs under phase contrast and of immunocytochemistry for KLF17 (red) and OCT3/4 (green). Bars, 200 μm. (C) The expression of primed and naïve PSC markers. Shown are the relative expressions of common PSC markers (POU5F1 and NANOG), a primed PSC marker (ZIC2) and naïve PSC markers (KLF4 and KLF17). Values are normalized by GAPDH and compared with primed H9 ESCs. n = 3. (D) Global transcriptome. Scatter plots comparing the microarray data of ESRG WT and KO naïve PSCs. The colored plot indicates DEG with statistical significance (FC>2.0, FDR,0.05). The numbers of DEGs (FC>2.0, FDR,0.05) are shown in the figure. n = 3. (E) Differentiation to primed pluripotency. Representative images of ESRG WT and KO naïve PSCs before and after conversion to the primed pluripotent state are shown. Bars, 200 μm. (F) The expression of primed and naïve PSC markers. Shown are the relative expressions of the marker genes in (C) in ESRG WT and KO naïve PSCs before and after the differentiation to the primed pluripotent state. Values are normalized by GAPDH and compared with primed H9 ESCs. n = 3. Numerical values for A, C, and F are available in S1 Data.

