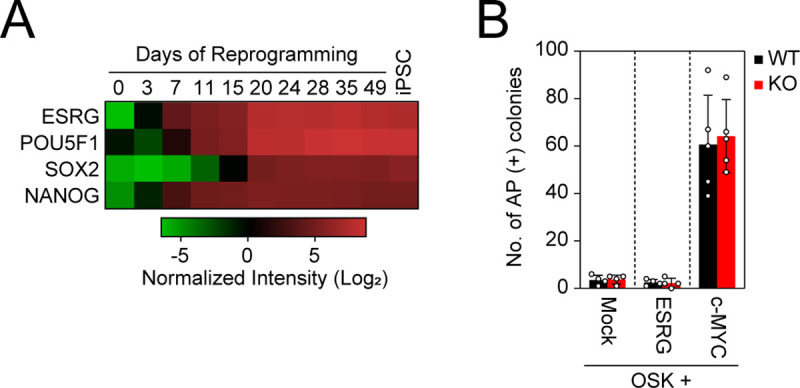
Fig 5. ESRG is dispensable for iPSC reprogramming.

(A) The expression of ESRG during reprogramming. The heatmap generated by using the dataset (GSE54848) shows the normalized intensities of ESRG, POU5F1 (endogenous), SOX2 (endogenous), and NANOG expression from microarray data in the time course of iPSC reprogramming (days 0–49) and established iPSCs (far right). n = 3. (B) The effect of ESRG on iPSC generation. Shown are the numbers of AP (+) iPSC colonies 24 days after the transduction of OSK along with Mock (n = 4), ESRG (n = 4), and c-MYC (n = 5). Numerical values for A and B are available in S1 Data.
