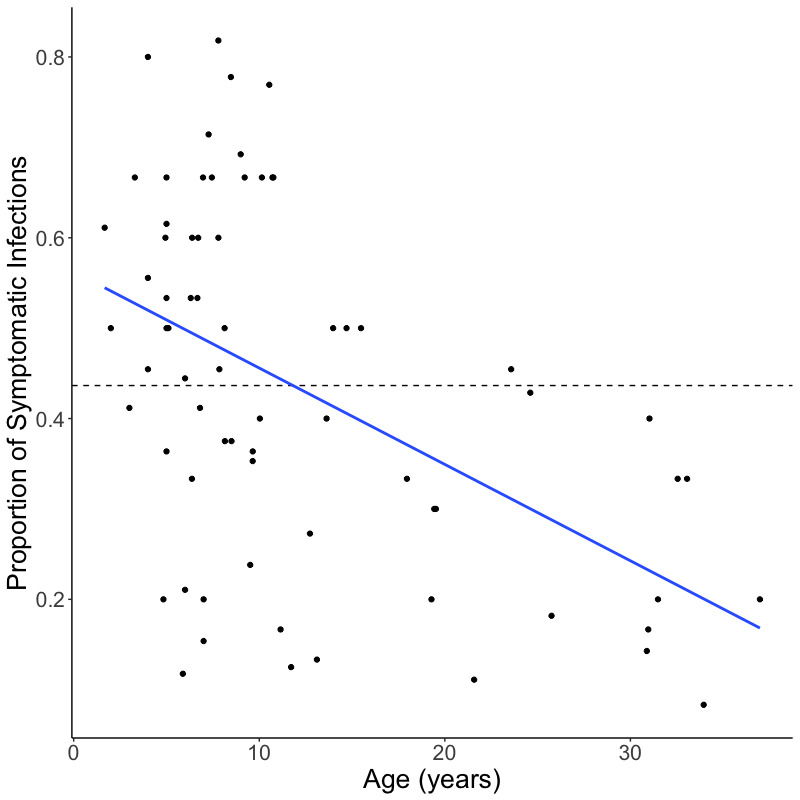
Fig 1. Relationship between proportion of symptomatic infections and age.

Scatterplot, including linear regression line (blue), shows the relationship between the proportion of symptomatic infections per individual over the course of the study and age of the individual at enrollment. The dashed line shows median proportion of symptomatic infections, which was used to define the high and low immunity groups.
