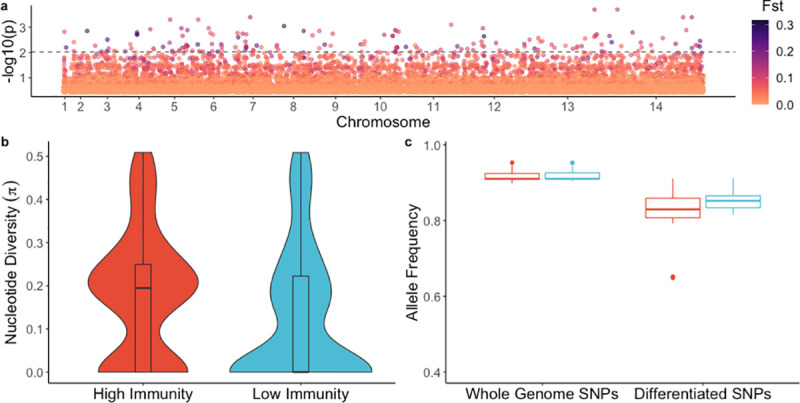
Fig 2. Genetic differentiation between parasites from high immunity vs. low immunity groups.

a) Genome-wide genetic differentiation (FST) between parasites from individuals with higher immunity vs. lower immunity. Each point represents a variable, non-synonymous site. Results are plotted as–log10 p-values on the y-axis. The color of each point represents the FST value, with darker points indicating higher FST values. The dashed line denotes statistical significance (p-value = 0.0095), with p-value determined by permutation. b) Nucleotide diversity for significantly differentiated SNPs in parasites from individuals with higher immunity and lower immunity. c) Box-plot of mean allele frequency per individual based on SNPs in the whole genome sequences, and which are significantly differentiated SNPs from (a). Red indicates the high immunity group and blue color indicates the low immunity group.
