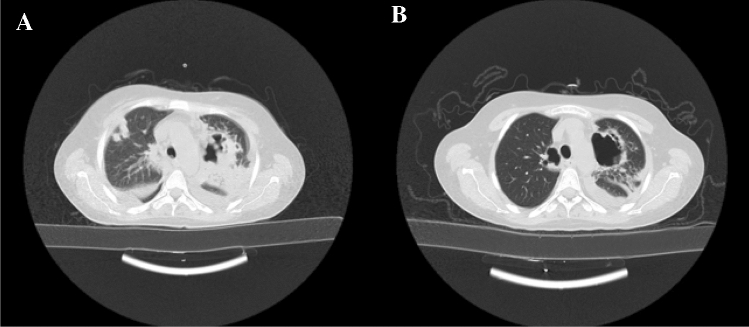
Fig. 2.
Thoracic computed tomography images of Case 2, before and after immunosuppressive therapy. A Thoracic CT taken a couple of weeks after the confirmation of COVID-19 infection, on which the bilateral pleural effusion and perihilar cavitation can be observed. B Regression of pleural effusion and GGOs during the first week of immunosuppressive treatment given after the diagnosis of AAV

