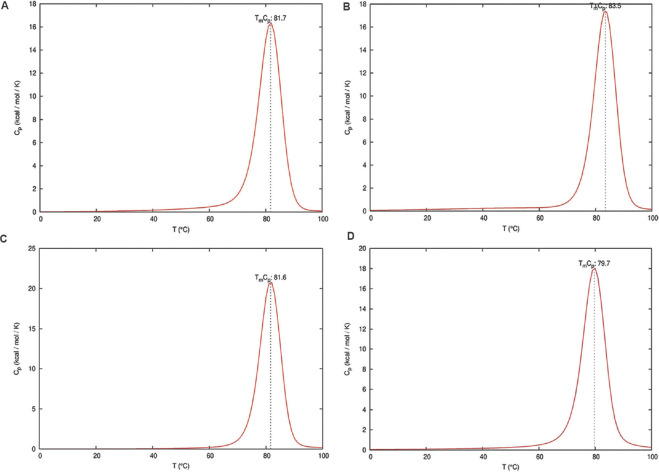
Fig. 4.
Equilibrium melting profile of the hybridized siRNAs in terms of heat capacity (Cp) plot. Heat capacity plots of siRNAs_1-4 are represented in (A-D), respectively. X-axis represents temperature in degree Celsius and Y-axis represents the heat capacity which is calculated by numerical differentiation of the ensemble free energy.

