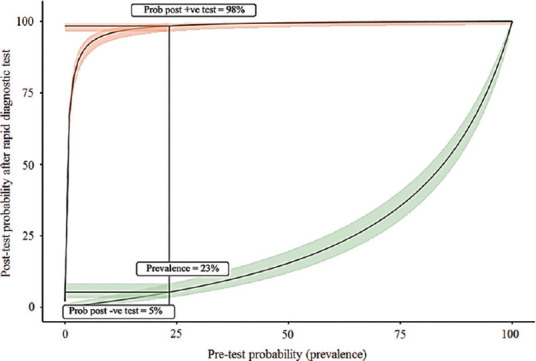
Fig. 1.

A plot of the post-test probability against the pre-test probability of having COVID-19. The green and orange ribbons represent the 95% confidence interval around these values. The vertical line indicates the pre-test probability or prevalence of COVID-19 (23.3%). Where this vertical line cuts the green and orange lines, those points give the probabilities that if the result of the rapid diagnostic test is negative, then COVID-19 is absent, and if the result is positive, the disease is present.
