
Fig. 2.
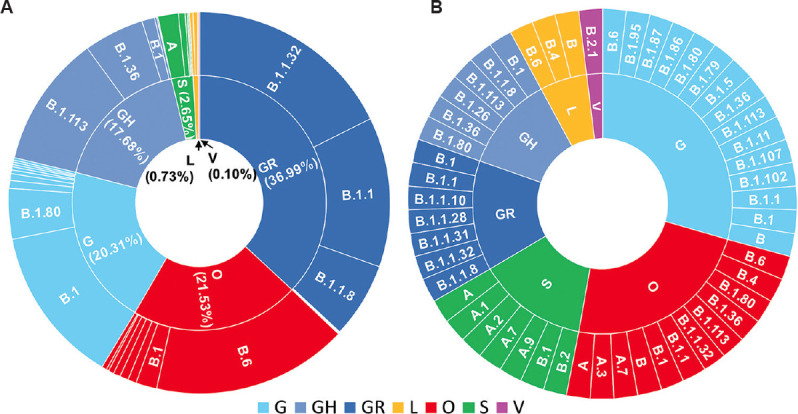
Sunburst diagrams coloured according to Global Initiative on Sharing All Influenza Data (GISAID) clades showing relationship between GISAID and Phylogenetic Assignment of Named Global Outbreak LINeages (Pangolin) annotations on the inner and outer circles, respectively for the Indian SARS-CoV-2 genomes (n=3014). (A) The proportionate chart showing dominant Pangolin corresponding to each of the GISAID clades (The count for individual clades/lineages is shown in Supplementary Table II). (B) The schematic representation of association between the GISAID clades and the Pangolin lineages.