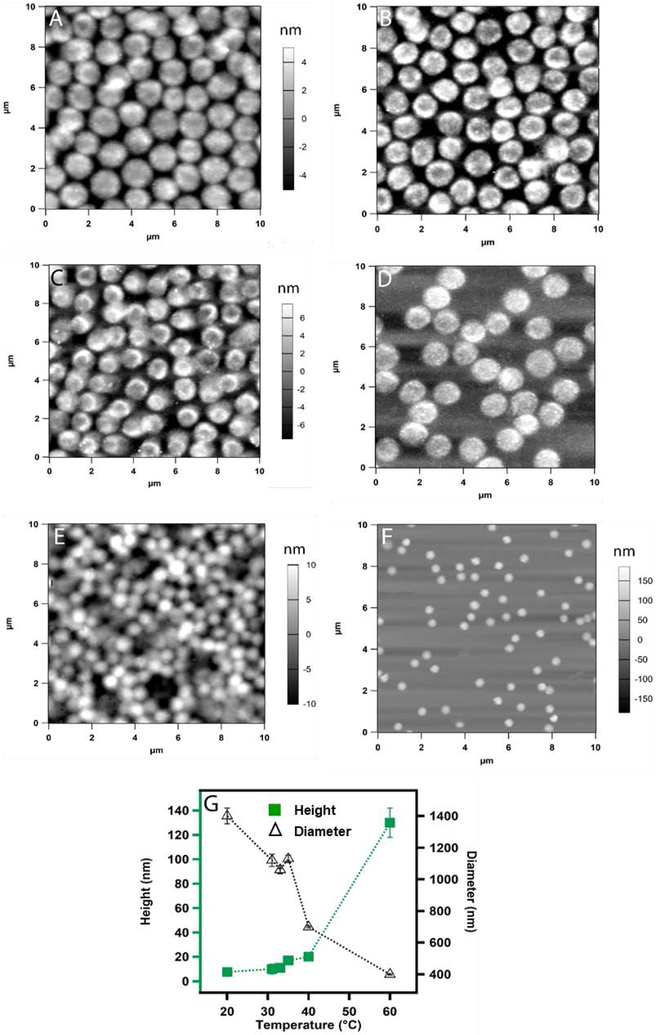
Figure 4.
AFM images (A-E) of actively deposited ULC10AAc microgels from pH 4.5 solution. The deposition was carried out at (A) 20 °C (B) 31 °C (C) 33 °C (D) 35 °C and (E) 40 °C. Passive deposition was used for sample (F) at 60 °C. The z-scale shown with panel A is same for B and the z-scale shown with panel C is same for D. Here (G) represents the plot of the change in height and diameter of the particles at different temperatures. Each data point represents the average of at least three independent measurements and the error bars are calculated as the standard deviation for those values.

