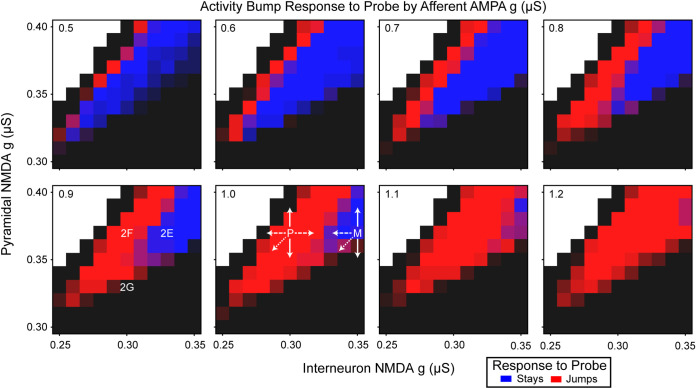
Fig 3. Activity bump response to the probe as a function of excitation, inhibition, and afferent signal.
The afferent AMPA conductance (g) is indicated in the top left of each panel. The degree of blueness indicates the percentage of trials in which the activity bump maintained the cue representation, and redness indicates the percentage of trials in which the activity bump jumped to the probe representation. The black and white regions indicate excitation-inhibition balances that were incapable of maintaining representation of the cue, albeit for different reasons. The degree of blackness indicates the percentage of trials in which the activity bump collapsed prior to the probe or that the cue representation was never initiated, and white indicates the parameter region in which the pyramidal cell firing was epileptic (i.e., showed an extremely high firing rate across the entire population that does not represent information). The P and M in the 1.0 AMPA conductance panel are the locations of the context-integration agent’s perception and memory networks (Fig 4A) within NMDA conductance parameter space. The arrows coming from these indicate various manipulations that were performed to these networks. The solid line is pyramidal cell NMDA conductance manipulation, the dashed line is interneuron NMDA conductance manipulation, and the dotted line is manipulation of both.

