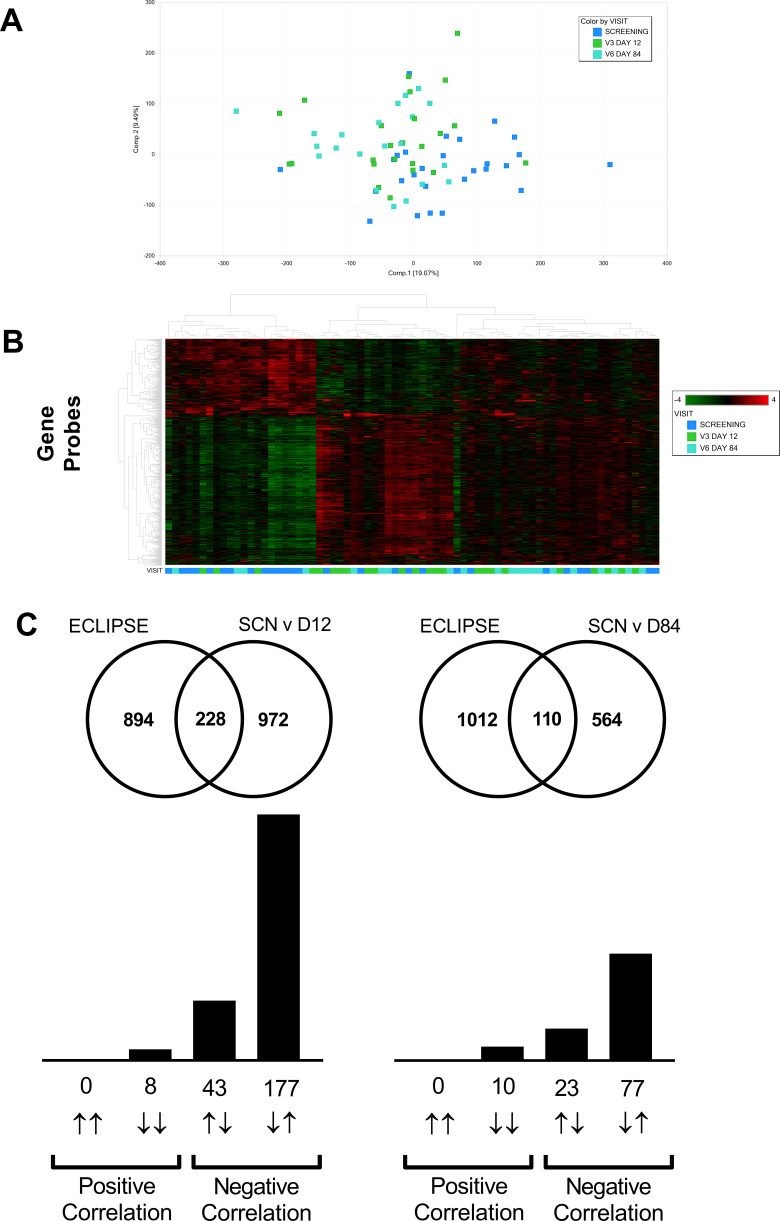
Figure 5.
Lung transcriptomics during exacerbation recovery (Study B). Combined sputum transcriptomic data shows partial clustering by time point (Panels A and B). Unbiased overlay analysis showed a highly significant overlap with data from ECLIPSE .27,30 The degree of overlap and gene directionality for the matching genes are displayed in (Panel C).

