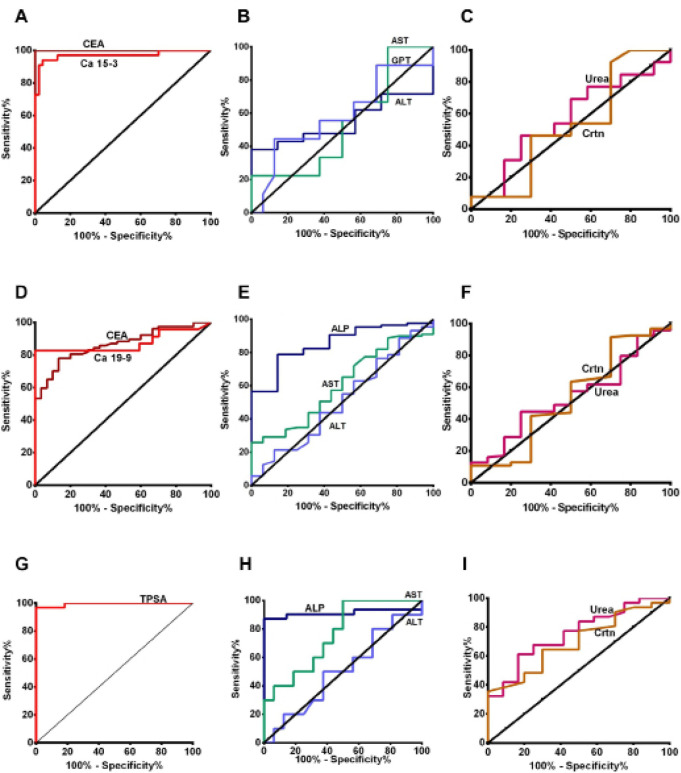
Figure 1.
ROC Curve for the Level of Serum Tumour Markers, Liver and Renal Function Tests in BC, CRC and PCa Patients. A, B, C represent Ca15-3, CEA, liver and renal function tests in BC patients, respectively. D, E, F represent Ca19-9, CEA, liver and renal function tests in CRC patients, respectively. G, H, I represent TPSA, liver and renal function tests in PCa patients, respectively

