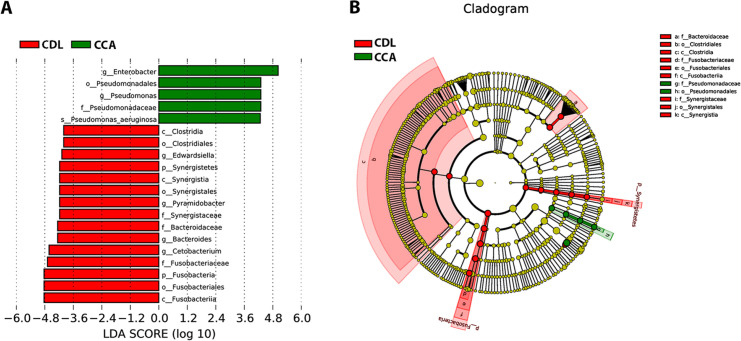
Figure 4.
Histogram of the LDA Scores (A) and Cladogram (B) are Shown as Results of LEfSe Analysis for Evaluation of Biomarkers that Differ Statistically Significantly among Groups. c, class; o, order; f, family; g, genus. The letter a-k in the cladogram is the name of bacteria. The levels represent, from the inner to outer rings, genus, family, order, class, and phylum (B)

