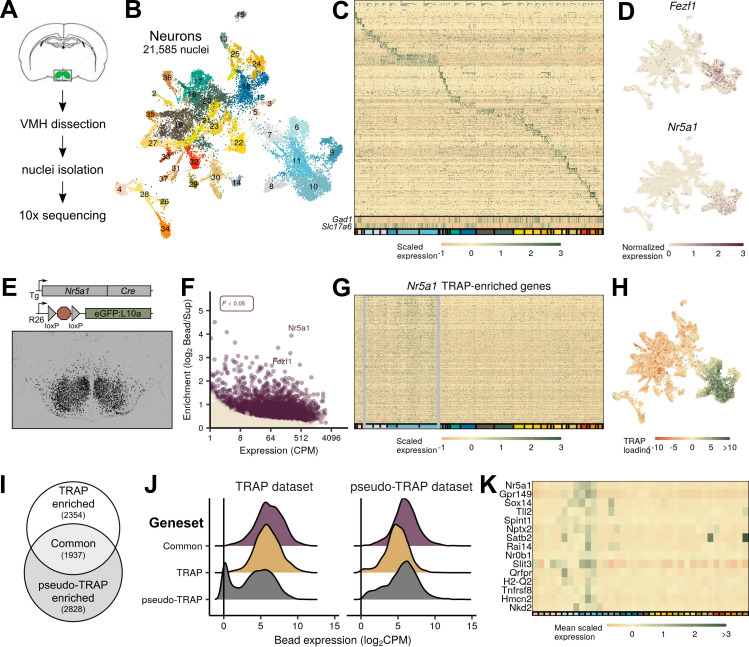
Figure 1. Identification of ventromedial hypothalamic nucleus (VMH) neurons from mice.
(A) Schematic of VMH isolation and single-cell sequencing protocol. (B) UMAP of 21,585 neuronal nuclei colored and labeled by cluster designation. (C) Expression profile of the top enriched genes for each cluster (colored on bottom), including GABAergic (Gad1) and glutamatergic (Slc17a6) markers. (D) Expression of Nr5a1 and Fezf1 in individual cells in UMAP space. (E) Nr5a1-Cre translating ribosome affinity purification with RNA-sequencing (TRAP-seq) overview. Nr5a1-Cre mice were crossed with ROSA26eGFP-L10a mice, resulting in VMH-restricted eGFP-L10a expression. Representative image shows GFP-IR (black) in a coronal section from these mice. (F) TRAP-seq revealed the enrichment of thousands of genes (including Nr5a1 and Fezf1) in these cells relative to non-TRAP material. (G) Expression profile of the top enriched genes from Nr5a1-Cre TRAP-seq across clusters; gray box indicates presumptive VMH cells. (H) Magnitude of the first principal component after performing principal components analysis for the genes enriched in Nr5a1-Cre TRAP-seq. (I) Venn diagram of genes enriched in Nr5a1-Cre TRAP-seq (TRAP enriched), in single-nucleus RNA-sequencing (snRNA-seq) VMH pseudo-TRAP (pseudo-TRAP enriched), or both (common). Number in parentheses refers to the number of genes in each category. (J) Histograms of expression level for genes by enrichment gene set in each dataset (Nr5a1-Cre TRAP-seq or snRNA-seq). (K) Mean scaled expression for each cluster for the top genes enriched in Nr5a1-Cre TRAP-seq.


