. 2021 May 21;10:e69065. doi: 10.7554/eLife.69065

Figure 2. Ventromedial hypothalamic nucleus (VMH) neuronal populations can be grouped into six major classes.

(A) UMAP of 6049 VMH neurons colored and labeled by cluster designation. (B) Prevalence of clusters across samples, mean ± SEM. (C) Expression profile of the top enriched genes for each cluster. (D) Hierarchical clustering and mean expression of marker genes for each class of neurons. (E) ESµ for the top three marker genes for each population determined by CELLEX. (F) Median maximal pairwise expression correlation for each cut of the hierarchical tree resulting in 2–24 clusters. (G) Percent of cells in each VMH cluster that correspond to each neuronal cluster (from Figure 1). (H) ESµ for the top five marker genes for each major class determined by CELLEX.

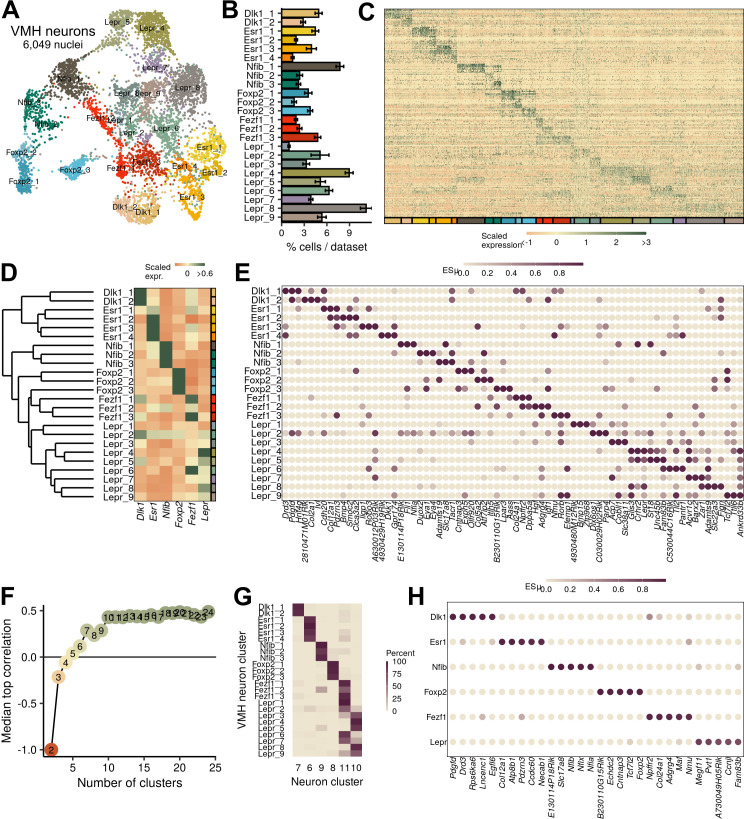
Figure 2.

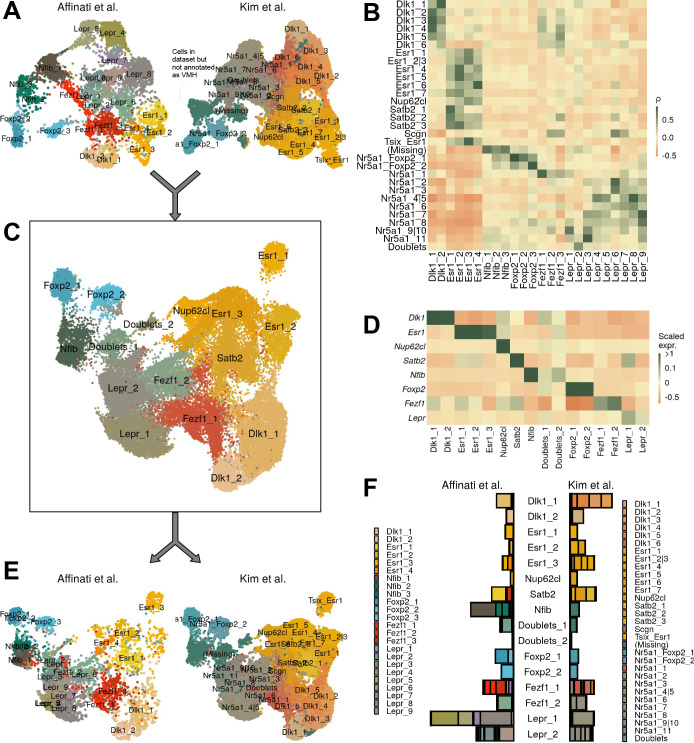
Figure 2—figure supplement 1. Comparison with ventromedial hypothalamic nucleus (VMH) data from Kim et al.

Figure 2—figure supplement 1.

(A) UMAP of each dataset separately. Cells labeled ‘(Missing)’ were present in the dataset but were excluded from final VMH clustering. (B) Pairwise expression correlation of variable genes for each cluster in each dataset. (C) UMAP of canonical correlation analysis (CCA)-integrated data, colored by cluster. (D) Mean scaled expression of marker genes for each cluster. (E) UMAP of integrated data, by dataset of origin. (F) Breakdown of cluster designation from original dataset and integrated dataset.
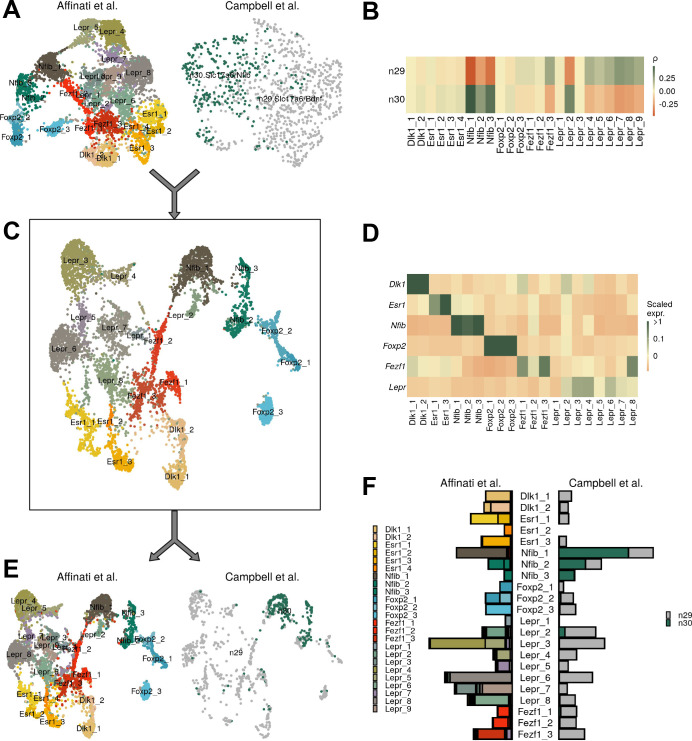
Figure 2—figure supplement 2. Comparison of data with ventromedial hypothalamic nucleus (VMH) data from Campbell et al.

Figure 2—figure supplement 2.

(A) UMAP of each dataset separately. (B) Pairwise expression correlation of variable genes for each cluster in each dataset. (C) UMAP of canonical correlation analysis (CCA)-integrated data, colored by cluster. (D) Mean scaled expression of marker genes for each cluster. (E) UMAP of integrated data, by dataset of origin. (F) Breakdown of cluster designation from original dataset and integrated dataset.
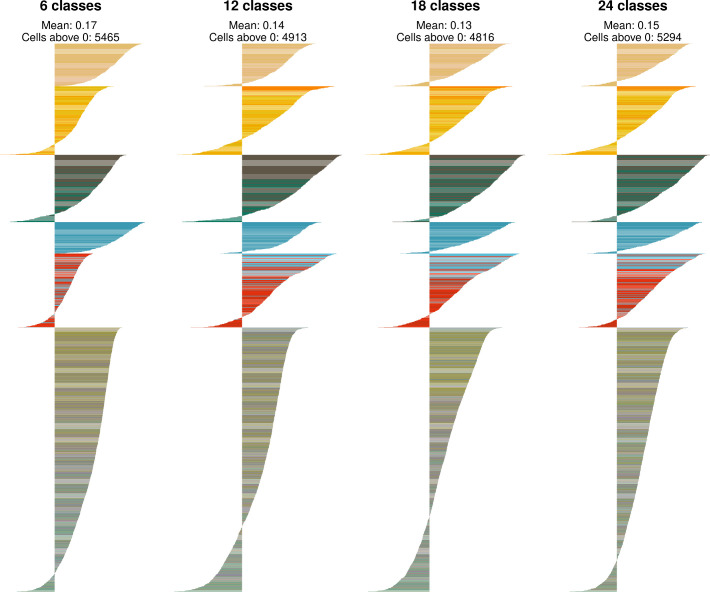
Figure 2—figure supplement 3. Identification of ventromedial hypothalamic nucleus (VMH) neuronal ‘classes’.

Figure 2—figure supplement 3.

The silhouette width for each cell for each level of VMH neuron classification. The mean silhouette width and the number of cells with a silhouette width greater than 0 are noted above the plot. Cells are colored by their cluster color in Figure 2A.
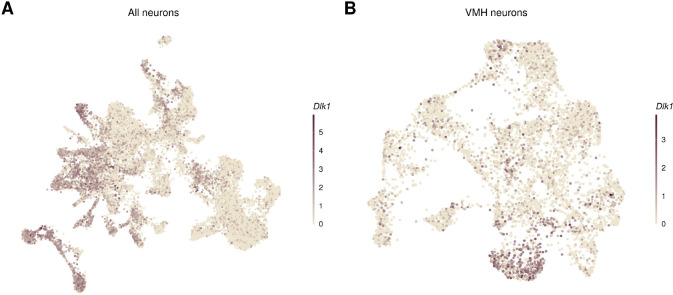
Figure 2—figure supplement 4. Dlk1 is expressed in neurons adjacent to the ventromedial hypothalamic nucleus (VMH).

Figure 2—figure supplement 4.

Dlk1 expression in the UMAP of (A) all neurons (with the VMH neurons outlined) and (B) VMH neurons.
Figure 2—figure supplement 5. Ventromedial hypothalamic nucleus (VMH) Nfib population localizes to dorsomedial compartment.

Figure 2—figure supplement 5.

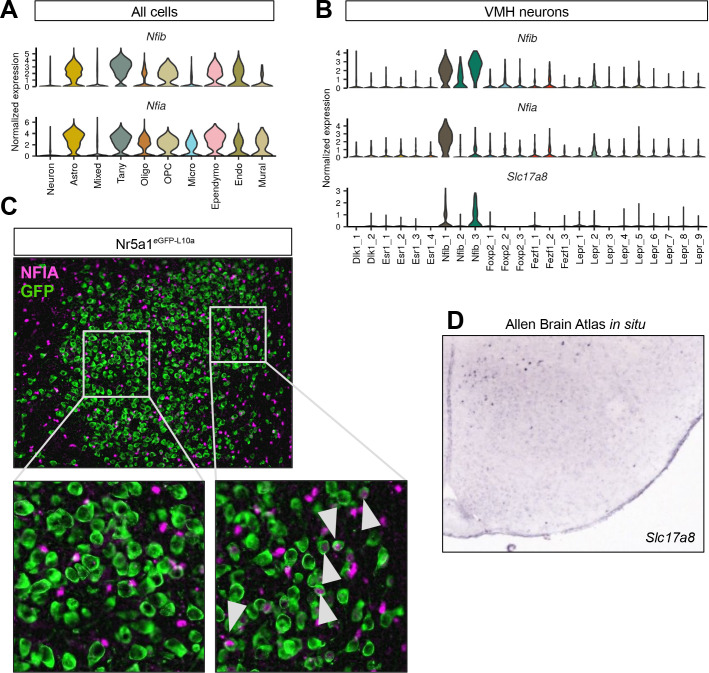
(A–B) Nfia marks (B) a subset of VMHNfib neurons but is also widely expressed in (A) non-neuronal populations in the VMH. (C) Representative image showing GFP-IR (green) and NFIA-IR (magenta) in Nr5a1eGFP-L10a (Nr5a1-Cre;R26eGFP-L10a) mice; white arrowheads indicate colocalization. (B) Slc17a8 is a marker for VMHNfib cells and (D) is expressed in the most dorosmedial VMH according to the Allen Brain Atlas in situ database.
Figure 2—figure supplement 6. Foxp2 population localizes to anterolateral (‘tuberal’) compartment.

Figure 2—figure supplement 6.

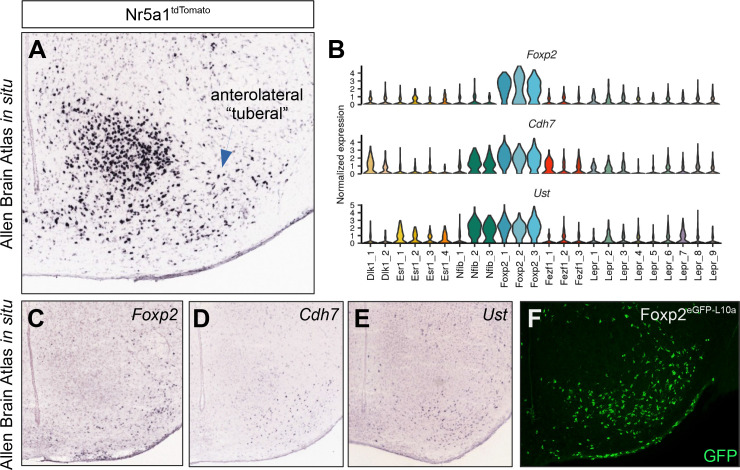
(A) Allen Brain Atlas in situ for tdTomato in Nr5a1tdTomato mice (Nr5a1-Cre;R26LSL-tdTomato) shows widespread expression outside of the core ventromedial hypothalamic nucleus (VMH) in an area referred to as the tuberal nucleus. (B) The VMHFoxp2 population is also marked by Cdh7 and Ust expression. (C–E) Allen Brain Atlas in situ images for (C) Foxp2, (D) Cdh7, and (E) Ust show expression in the tuberal VMH. (F) Representative image showing the distribution of GFP-IR (green) in Foxp2eGFP-L10a (Foxp2Cre/+;R26eGFP-L10a) mice in the tuberal region.