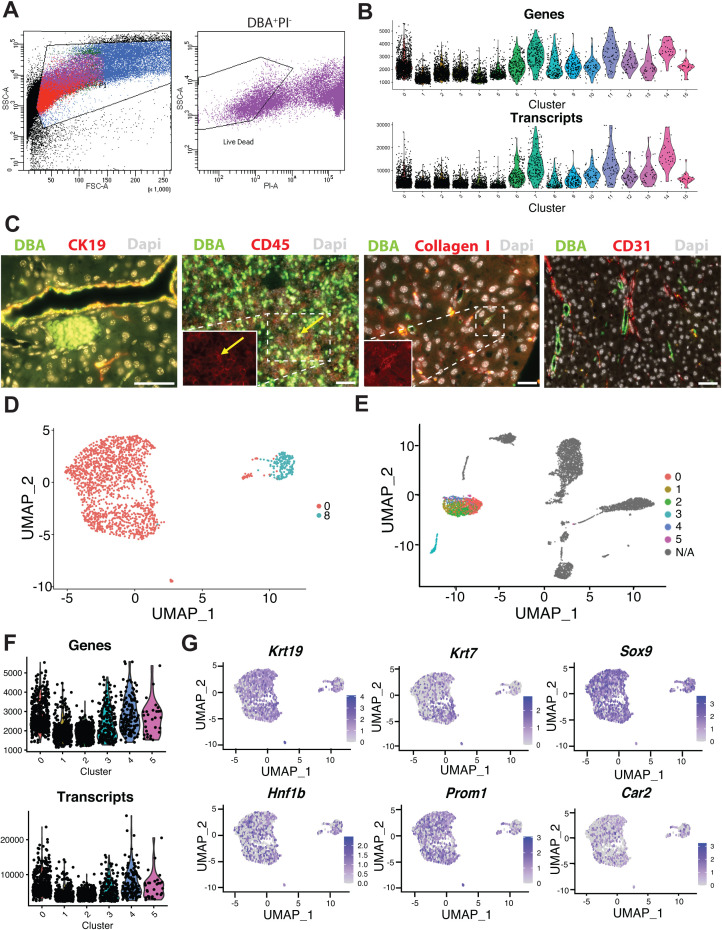
Figure 1. Transcriptomic map of DBA+pancreatic cells.
(A) Schematic of experiment workflow. (B) The Uniform Manifold Approximation and Projection depicts murine pancreatic DBA+ cells obtained using the protocol. (C) A matrix plot shows average expression of ductal cell markers in all clusters, identifying clusters 0 and 8 as ductal cells. (D) Feature plots illustrate markers of various cell types including epithelial (Epcam), ductal (Krt19 and Sox9), CD45+ immune cells (Ptprc), endothelial cells (Pecam1), fibroblasts (Col1a1), endocrine cells (Chga), and acinar cells (Pnliprp1). We observed low-level expression of acinar cell markers uniformly across all clusters that is likely contaminating acinar cell mRNA.


