. 2021 May 19;10:e67776. doi: 10.7554/eLife.67776

Figure 2. Transcriptomic map of DBA+pancreatic duct cells.

(A) Uniform Manifold Approximation and Projection (UMAP) depicts identity of clusters. (B) The dot plot shows the top five significantly differentially expressed genes (DEGs) with the highest fold change for each cluster. (C) Feature plots show expression of significantly DEGs for clusters 0, 1, 3, 4, and 5. Cluster 2 is characterized by lack of or low-level expression of significantly DEGs found in other clusters. (D) Ingenuity pathways analysis (IPA) results show the top eight deregulated pathways when comparing a cluster to all other clusters. The ratio line indicates the fraction of molecules significantly altered out of all molecules that map to the canonical pathway from within the IPA database. A positive z-score represents upregulation, and a negative z-score indicates downregulation of a pathway in that cluster when compared to all other clusters. A gray bar depicts significant overrepresentation of a pathway, the direction of which cannot yet be determined.

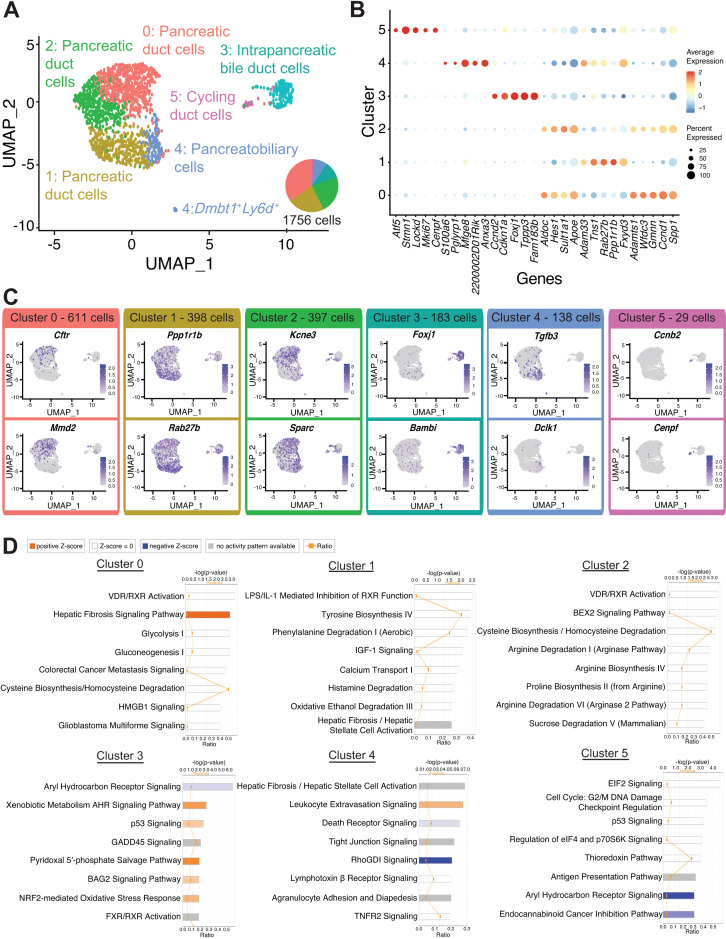
Figure 2—source data 1. Differentially expressed genes in all DBA+ duct clusters.
Figure 2—source data 2. Ingenuity pathways analysis results for all DBA+ duct clusters.
Figure 2—source data 3. Ingenuity pathways analysis upstream regulator analysis results for all DBA+ duct clusters.
Figure 2—source data 4. Number of cells and average number of genes and transcripts in all DBA+ duct clusters.

Figure 2.

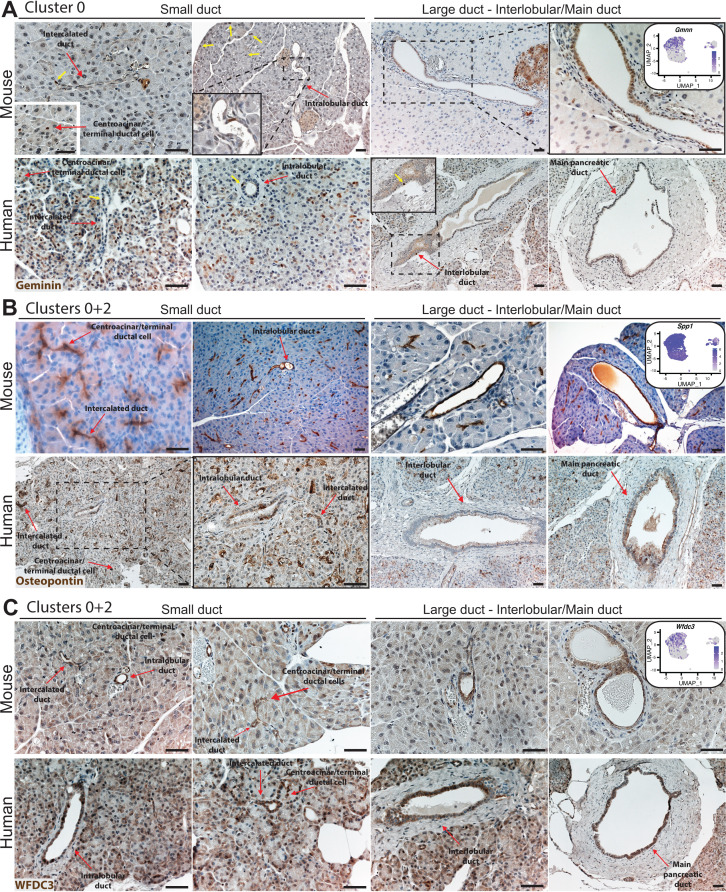
Figure 2—figure supplement 1. IHC illustrates expression of markers in clusters 0 and 2 in the mouse and human ductal tree.

Figure 2—figure supplement 1.

(A) Geminin is expressed in rare ductal cells and acinar cells in the mouse and human pancreas. Yellow arrows point to geminin-positive cells. (B) Osteopontin expression is observed in all duct cell types throughout the mouse and human ductal tree as well as in acinar cells. (C) WFDC3 is expressed in all duct cell types in the mouse and human pancreas and in acinar cells. Red arrows point to the indicated duct type. Scale bars are 40 µm.
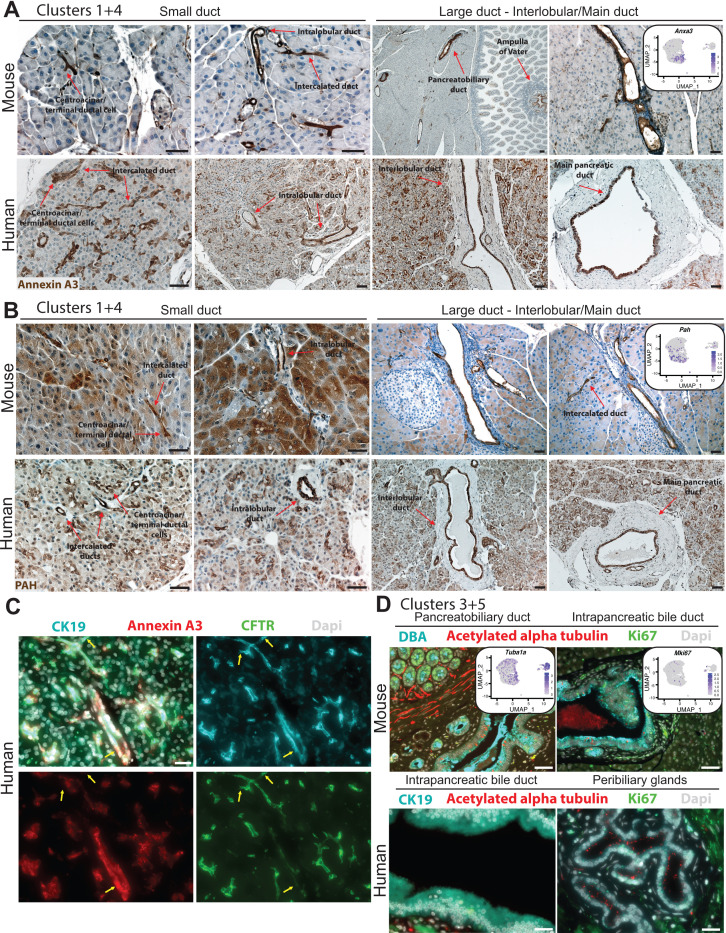
Figure 2—figure supplement 2. IHC and IF depict expression of markers in clusters 1, 3, 4, and 5 in mouse and human pancreas duct cells.

Figure 2—figure supplement 2.

(A) Annexin A3 expression is observed in all ductal cell types in the mouse and human pancreas. The left mouse IHC image under Large duct – Interlobular/Main duct shows Annexin A3 cytoplasmic expression in pancreatobiliary cells and cells within the Ampulla of Vater. Scale bars are 40 µm. (B) PAH is expressed in all duct types throughout the mouse and human ductal tree as well as in acinar cells. Scale bars are 40 µm. (C) Yellow arrows point to heterogeneous expression of ductal markers CFTR, Annexin A3, and CK19 in human pancreatic duct cells. Scale bars are 20 µm. (D) Proliferating and acetylated alpha tubulin-positive duct cells are observed in the intrapancreatic bile duct, peribiliary glands, and pancreatobiliary cells in mouse and human. Scale bars are 50 µm.
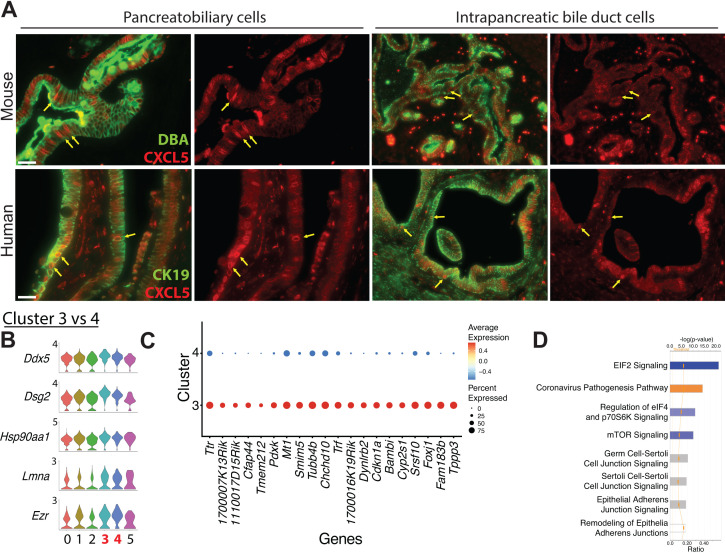
Figure 2—figure supplement 3. Characteristics of intrapancreatic bile duct and pancreatobiliary cells.

Figure 2—figure supplement 3.

(A) CXCL5, another marker of the Dmbt1+Ly6d+ subpopulation,-positive cells are located in murine and human intrapancreatic bile duct cells, peribiliary glands, and pancreatobiliary cells. Yellow arrows point to ductal cells displaying upregulated CXCL5. Scale bars are 50 µm. (B) Stacked violin plots show expression of five genes, which are upregulated in clusters 3 and 4. (C) The dot plot shows the top 20 differentially expressed genes ranked by fold change when comparing cluster 3 vs. 4.
Figure 2—figure supplement 3—source data 1. Differentially expressed genes comparing duct cluster 3 vs. 4.
Figure 2—figure supplement 3—source data 2. Ingenuity pathways analysis results comparing duct cluster 3 vs. 4.
Figure 2—figure supplement 3—source data 3. Ingenuity pathways analysis upstream regulator analysis comparing duct cluster 3 vs. 4.