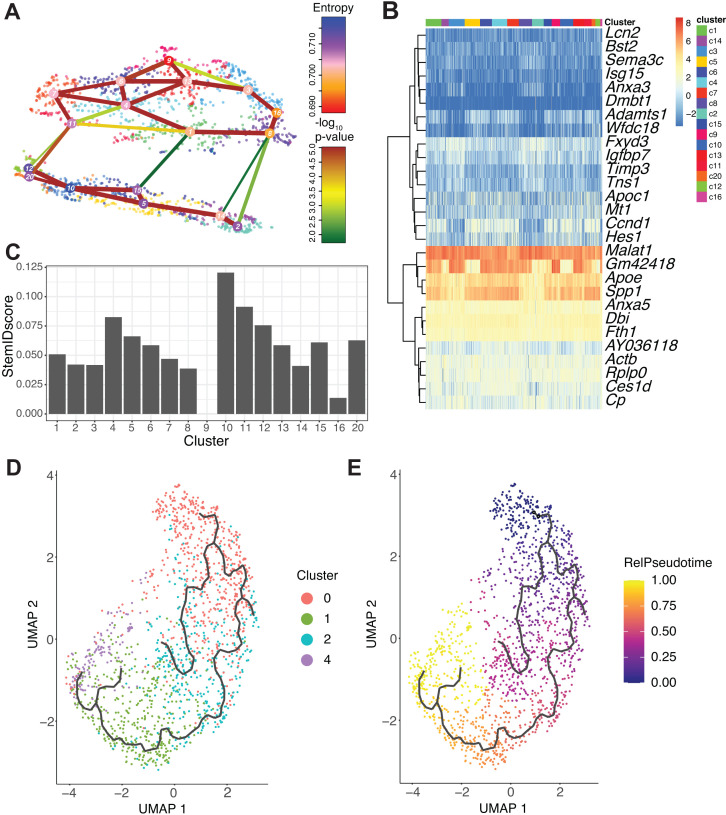
Figure 4. RaceID3/StemID2 predict clusters 0 and 2 have the highest progenitor potential.
(A) The lineage tree inferred by StemID2 is shown in the RaceID3 clusters. Node color represents the level of transcriptome entropy, edge color describes the level of significance, and edge width describes link score. (B) Heat map depicts expression of top five differentially expressed genes in RaceID3 clusters with false discovery rate < 0.01 and fold change > 1.2. (C) StemID2 scores for RaceID3 clusters are graphed. (D) Monocle 3 clustering of murine DBA+ duct clusters 0, 1, 2, and 4 is depicted. (E) Each cell’s relative pseudotime value is depicted that is a measurement of the distance between its position along the trajectory and the starting point (cluster 0).

