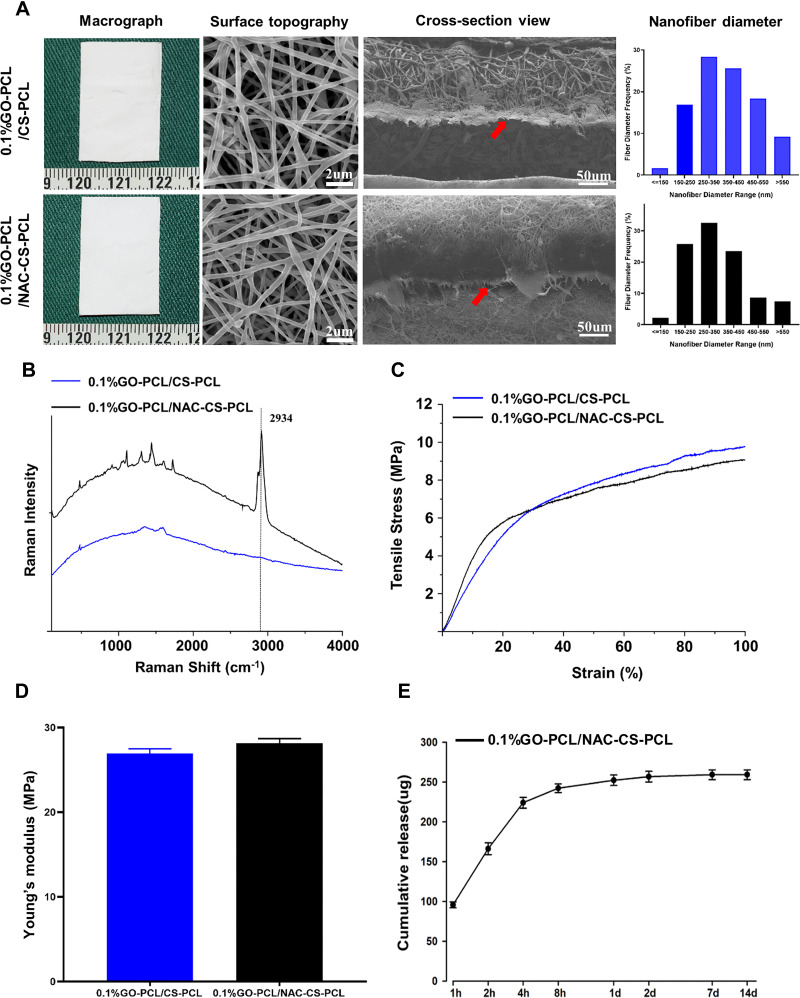
Figure 3.
Characterization of the GO-PCL/CS-PCL, GO-PCL/NAC-CS-PCL scaffolds.
Notes: (A) Macrographs, FESEM images, and histogram showing the nanofiber diameter of scaffolds. The red arrow shows the double-layer structure. (B) Raman spectroscopy, (C) tensile stress–strain curve and (D) Young’s modulus of the scaffolds. (E) Time-dependent cumulative release profile of NAC from the scaffolds.

