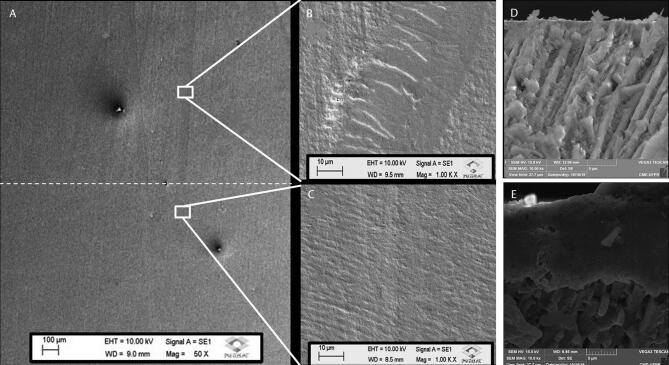
Fig. 1.
Figure 1 ( A ) shows a representative scanning electron micrograph of the enamel surface (magnification 50x); above the line represents the control demineralized area; the area below the line represents the remineralized treated area. Figure 1 ( B ) shows a representative area of the demineralized enamel. Figure 1 ( C ) shows a representative area in which the enamel was remineralized and regenerated. Figure 1 ( D ) shows the cross-sectional area of the control, demineralized enamel half. Figure 1 ( E ) shows a representative scanning electron microscope (SEM) photomicrograph image the cross-section of enamel block in which a mineralized layer is formed at the treated enamel surface.

